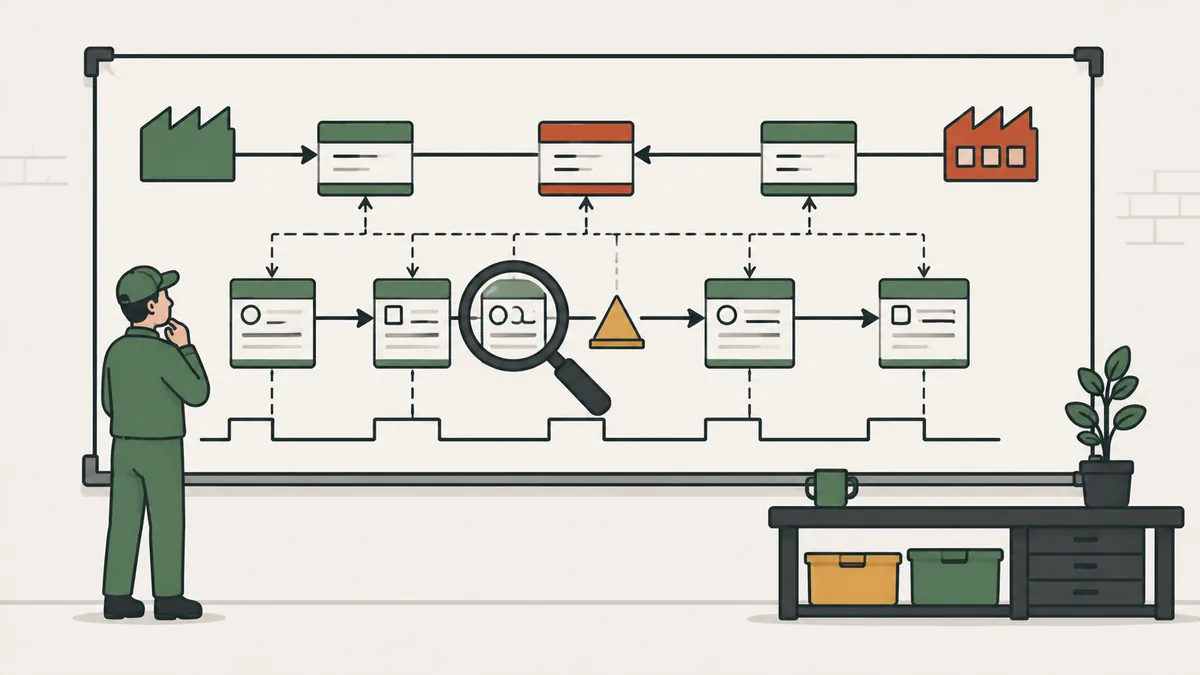
- What value stream mapping is
- Map elements: what to draw and what to record
- Step 1: the current state map
- Worked example: 11 days of waiting and 165 seconds of work
- Step 2: the future state map
- How to read the map and find the waste
- Step 3: from the map to an action plan
- VSM, flowchart and SIPOC: which to use
- Common mistakes
- Next step
- Frequently asked questions
What value stream mapping is
Value stream mapping (VSM) is a diagram of all the steps in the material and information flows needed to take a product from order to delivery. The Lean Enterprise Institute explains that Toyota developed the tool, which it calls a material and information flow diagram, as part of the Toyota Production System.
A value stream is the set of all actions, value-adding or not, required to bring a product from raw material to the customer. VSM draws that flow on one sheet and puts numbers on each step: cycle time, inventory, batch size, uptime.
The goal is not a pretty drawing. It is to see where the product waits, why it waits and how far apart two numbers are: the total time the product takes to cross the plant (lead time) and the time it actually receives work. That gap is almost always huge.
Map elements: what to draw and what to record
The map has three areas: material flow at the bottom, information flow at the top and a timeline at the base. Every element carries data.
| Element | What it represents | Data recorded |
|---|---|---|
| Customer and supplier | Who orders and who delivers | Daily demand, shifts, delivery frequency |
| Process box | A step with continuous flow | Cycle time (C/T), changeover time (C/O), uptime, operators, scrap |
| Inventory triangle | Material sitting between processes | Quantity and days of inventory |
| Push or pull arrow | How material moves forward | Pushed by schedule or pulled by kanban |
| Information flow | Forecasts, orders and scheduling | Who schedules each process and how often |
| Timeline | Sum of waits and process times | Lead time and value-added time |
Use few symbols and always the same ones. VSM is a shared language, and its value comes from everyone reading the map the same way.
Step 1: the current state map
- Choose a product family that goes through the same processes. Mapping the whole plant at once is a classic mistake.
- Start with the customer: daily demand, number of shifts and takt time.
- Walk the flow at the gemba, starting at shipping and moving upstream, recording each process with your own eyes.
- Collect data for each box: cycle time, changeover time, uptime, number of operators and scrap.
- Count the inventory between processes and convert it to days.
- Draw the information flow: how orders arrive and how production is scheduled.
- Close with the timeline.
Walking backward has a reason. Starting at shipping, you begin with what the customer receives and find out who really pulls production. Draw the first map by hand, with pencil and paper. Software comes later, once the method is second nature. Bring a stopwatch only to confirm times the system does not record, and note the variation: a cycle time that swings widely should be recorded as a minimum and a maximum, not only an average.
Worked example: 11 days of waiting and 165 seconds of work
Illustrative example. A product family goes through cutting, welding and assembly. Demand is 400 parts per day, on one shift with 27,000 seconds available per day (7.5 net hours). Days of inventory equal the quantity divided by daily demand.
| Step | Inventory before | Days of waiting | Cycle time |
|---|---|---|---|
| Cutting | 2,400 parts | 6.0 days | 40 s |
| Welding | 1,200 parts | 3.0 days | 55 s |
| Assembly | 800 parts | 2.0 days | 70 s |
| Total | 11 days of lead time | 165 s adding value |
- Days of waiting: 2,400 ÷ 400 = 6.0; 1,200 ÷ 400 = 3.0; 800 ÷ 400 = 2.0. Sum: 11 days.
- Value-added time: 40 + 55 + 70 = 165 s, under 3 minutes.
- Takt time: 27,000 s ÷ 400 parts = 67.5 s per part.
- Process cycle efficiency (PCE): 165 s ÷ (11 days × 27,000 s) = 165 ÷ 297,000 = 0.056%, or about 0.06%.
The product takes 11 days to cross the plant and receives under 3 minutes of work. That gap is the picture of the wastes of waiting and inventory. Notice also that assembly, at 70 s, is slower than the 67.5 s takt: it cannot keep up with the customer. That is the first point to attack. To see how these times relate, read lead time: definition, calculation and reduction.
Step 2: the future state map
With the current state on the wall, the team draws the future state, the picture of how material and information should flow. These questions guide the drawing:
- What is the takt time?
- Where can we have continuous flow, with no inventory between steps?
- Where do we need a supermarket pulled by kanban?
- At which process will scheduling enter, the so-called pacemaker process?
- How do we level the mix with heijunka?
- Which improvements are needed, such as SMED or TPM?
| Measure | Current state | Future state (target) |
|---|---|---|
| Inventory before cutting | 2,400 parts (6.0 days) | 400 parts (1.0 day), in a supermarket pulled by kanban |
| Inventory before welding | 1,200 parts (3.0 days) | Zero: continuous flow in the cell |
| Inventory before assembly | 800 parts (2.0 days) | Zero: continuous flow in the cell |
| Assembly cycle time | 70 s | 65 s, below the 67.5 s takt |
| Lead time | 11 days | 1 day |
| Value-added time | 165 s | 160 s (40 + 55 + 65) |
| PCE | 0.06% | 0.59% (160 ÷ 27,000) |
The lead time target drops from 11 days to 1 day, a reduction of about 91%. The cutting, welding and assembly cell, with three operators, ends up with a cycle of at most 65 s per person, within takt. These are illustrative targets: in your case, the numbers come from your own map.
How to read the map and find the waste
With the map done, make four readings, in this order.
- Timeline: compare lead time with value-added time. If the ratio is a fraction of a percent, the problem is waiting, not machine speed.
- Inventory triangles: the biggest ones show where the flow breaks. Ask why the inventory exists: large batches, slow changeovers, unstable machines or independent scheduling.
- Cycle times against takt: a process slower than takt limits the pace of the whole chain. In the example, it is assembly.
- Information flow: if every process receives its own schedule, material is pushed and inventory grows. Scheduling a single point and pulling the rest usually fixes it.
Every finding becomes an action with a name and a date. If something on the map has no action tied to it, it is still just a drawing.
Step 3: from the map to an action plan
The future map is only worth something if it becomes a plan. Every improvement needs an owner, a date and a metric, and all of them should be tracked in PDCA cycles. Improvement points go on the map as kaizen bursts and become the work list.
| Action | Metric | Target |
|---|---|---|
| Reduce the assembly cycle | Cycle time | From 70 s to 65 s |
| Create an entry supermarket pulled by kanban | Days of inventory before cutting | From 6.0 to 1.0 day |
| Form the cutting, welding and assembly cell | Inventory between processes | From 2,000 parts (1,200 + 800) to zero |
| Schedule only the pacemaker process | Scheduling points | From 3 to 1 |
The LEI stresses that repeating the cycle of current state and future state, again and again, is the simplest way to see value and the sources of waste. Today's future state is tomorrow's current state.
VSM, flowchart and SIPOC: which to use
| Tool | What it shows | Use when |
|---|---|---|
| VSM | Material, information, inventory and times | You want to cut lead time and inventory |
| Flowchart | Sequence of decisions and activities | You want to document a procedure |
| SIPOC | High-level view: supplier, input, process, output, customer | You want to set the scope before going into detail |
Start with SIPOC to set boundaries, then use VSM to measure the flow. VSM also works in administrative processes, as in lean office, with documents or orders in place of parts.
Common mistakes
- Mapping the whole plant instead of one product family.
- Drawing the map in a meeting room, with system data, without going to the shop floor.
- Measuring cycle time with a single stopwatch reading, missing the variation.
- Counting inventory in parts instead of days, which hides the size of the wait.
- Drawing the future state and never creating the action plan.
- Treating the map as a one-time project instead of repeating it.
Next step
Choose a product family and go to the gemba with pencil and paper. Map from shipping upstream, convert each inventory to days and add them up. Compare lead time with value-added time and with takt. Draw the future state with no more than three big changes and turn each one into an action with a deadline.
Frequently asked questions
What is value stream mapping?
It is the mapping of the material and information flows of a product, from order to delivery.
How do you do a value stream map?
Choose a product family, walk the flow at the gemba from shipping upstream, record the data for each process, convert inventory to days and close with the timeline.
What is the difference between lead time and value-added time?
Lead time is the total time a product takes to cross the flow. Value-added time is only the part in which it receives work the customer values.
How do you calculate process cycle efficiency?
PCE = value-added time ÷ lead time, with both in the same unit. In the example, 165 s ÷ 297,000 s = 0.056%.
What is a future state map?
It is the drawing of how material and information should flow after the improvements, with continuous flow, supermarkets and a pacemaker process.
What symbols are used in a VSM?
Process box, inventory triangle, push and pull arrows, customer and supplier icons, information flow and a timeline.
Do I need software to do VSM?
No. Pencil, paper and a walk on the shop floor are the recommended way to draw the first map.
When should the VSM be redone?
After the improvements in the plan are in place, the future state becomes the new current state and the cycle starts again.
Sources
- Lean Enterprise Institute. Value Stream Mapping. Lean Lexicon. https://www.lean.org/lexicon-terms/value-stream-mapping/
- ROTHER, M.; SHOOK, J. Learning to See: Value Stream Mapping to Add Value and Eliminate Muda. Cambridge: Lean Enterprise Institute, 1999.
- WOMACK, J. P.; JONES, D. T. Lean Thinking: Banish Waste and Create Wealth in Your Corporation. New York: Free Press, 2003.
Want to apply VSM with other lean tools?
Download the free "Lean for Leaders" e-book and see how to turn the map into an action plan.
Download the e-book
About the author
Lean Manufacturing & Behavioral Management Specialist
Over 20 years in the automotive and metalworking industries (GM and Dana), Lean Manufacturing practitioner since 2006. SENAI instructor and mentor in Brazil’s Brasil Mais Produtivo program, delivering consulting, training and audits for 50+ companies, combining quality, productivity and people development.