- What are the wastes of Lean
- The wastes, with shop floor examples
- Common causes and countermeasures
- Waste outside the factory, and muda, mura and muri
- Why overproduction is the worst
- Worked example: a 20-minute cycle
- How to find and eliminate waste, step by step
- Common mistakes
- Next step
- Frequently asked questions
What are the wastes of Lean
Waste, or muda in Japanese, is any activity that consumes time, material, space or effort without adding value from the customer's point of view. The customer only pays for what turns the product or service into something they want.
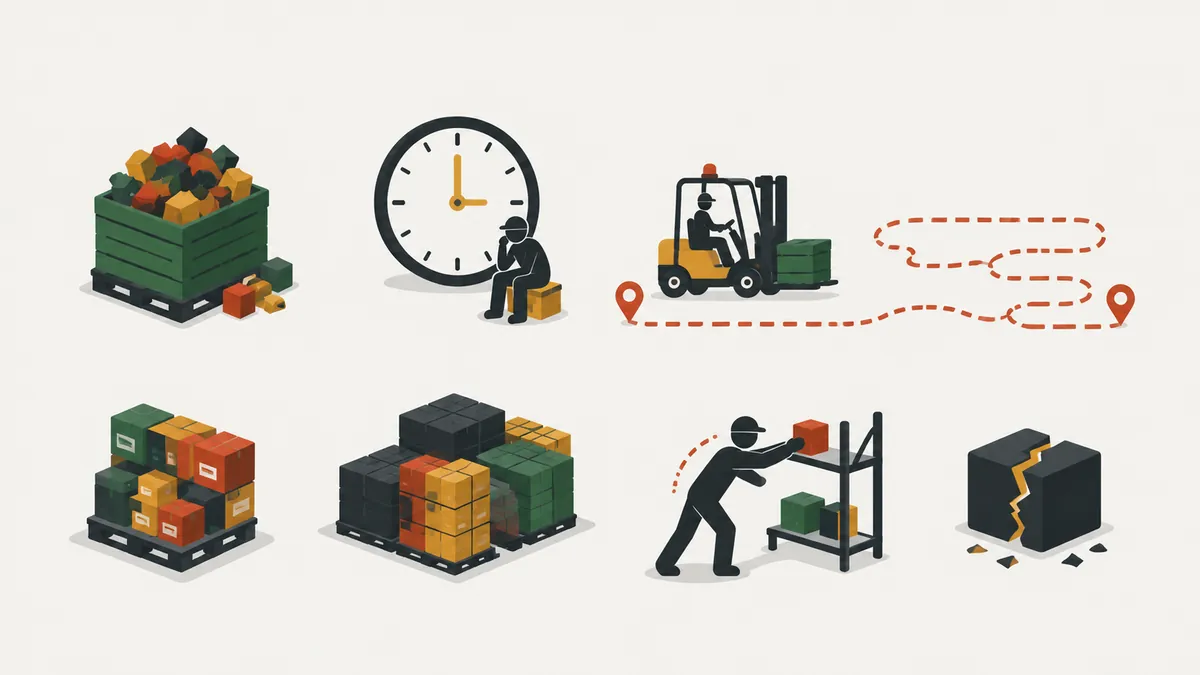
The original 7 wastes are Taiichi Ohno's classification, from the Toyota engineer who was one of the creators of the Toyota Production System, for the typical losses of mass production: overproduction, waiting, transportation, over-processing (extra processing), inventory, motion and defects (correction). Many practitioners add an 8th waste, non-utilized talent. That is why you will see both "7 wastes" and "8 wastes" in the literature.
The list varies a little from book to book. Use it as a practical way to see losses, not as a closed rule.
The central idea is simple and uncomfortable: in most processes, most of the product's time is not spent being transformed. It waits, travels, gets counted, gets checked and gets redone. Seeing that is the first step of lean, because nobody improves what they cannot see. And waste is rarely the fault of the people doing the work. It is almost always a result of how the process was designed.
The wastes, with shop floor examples
In the United States the list is usually remembered with the mnemonic DOWNTIME: Defects, Overproduction, Waiting, Non-utilized talent, Transportation, Inventory, Motion, Extra processing. Another common one is TIMWOODS: Transport, Inventory, Motion, Waiting, Overproduction, Over-processing, Defects, Skills.
| Letter | Waste | What it is | Shop floor example | Question to ask at the gemba |
|---|---|---|---|---|
| D | Defects (correction) | Inspection, rework, scrap and repair | Sorting good parts from bad at the end of the line | Where is the defect born and who finds it? |
| O | Overproduction | Making more, or earlier, than the next process or the customer needs | Running the full batch "since the machine is set up" | Will anyone consume this now? |
| W | Waiting | People or machines idle for lack of material, orders, tools or service | Waiting for the forklift to bring the bin | Who is idle and why? |
| N | Non-utilized talent | Ideas, skills and experience of the people doing the work that nobody uses | Improvement suggestions that never get an answer | When did we last act on an operator's idea? |
| T | Transportation | Moving material without need | Taking a part to the warehouse and back to the next station | Does this material really need to travel this far? |
| I | Inventory | Material above the minimum of a well controlled pull system | Piles of parts between operations | Why is there so much here, and for how long? |
| M | Motion | Operator movement that adds no value | Searching for tools, bending down for parts | Does the operator walk, reach or search unnecessarily? |
| E | Extra processing | Doing more than the customer requires, or in a more complicated way | Tolerance tighter than specified | Would the customer pay for this step? |
Several wastes show up together at the same station. Classify by whichever dominates and do not spend the meeting arguing about the label.
Overproduction. Making product without an order or ahead of time. It looks like productivity, because the machine never stops and the daily numbers look good, but the material sits waiting for demand.
Waiting. It includes the operator watching the machine run and the part sitting in a queue. Usually the time material waits is far longer than the time it is processed.
Transportation. Every move is a risk of damage and a cost, and it transforms nothing. The fix is usually layout, not a faster forklift.
Extra processing. Doing more than the customer asked: polishing a face nobody sees, printing three copies of a report, checking twice what was already checked.
Inventory. It hides problems. With plenty of parts between stations, a breakdown does not stop the flow, so nobody solves it for good.
Motion. Unlike transportation, this is body movement: walking, bending, searching, reaching. It adds minutes per cycle and turns into fatigue and ergonomic risk.
Defects. Defects, rework, scrap and the inspection that exists only to catch them. The farther from the source a defect is found, the costlier the fix.
Common causes and countermeasures
Each waste usually grows from a recurring cause. Knowing the cause keeps you from attacking only the symptom.
| Waste | Common cause | Typical countermeasure |
|---|---|---|
| Overproduction | Large batches, volume targets, slow changeovers | Pull production, smaller batches, shorter changeovers (SMED) |
| Waiting | Missing material, breakdowns, unbalanced stations | Routed material supply, planned maintenance, work balancing |
| Transportation | Long layout, stock far from the point of use | Flow layout, material at point of use, supply routes |
| Extra processing | Unknown specification, habit, fear of complaints | Agree requirements with the customer and standardize the finish required |
| Inventory | Poor forecast, minimum lots, distrust of the supplier | Supermarket with kanban, leveling, reliable suppliers |
| Motion | Poorly designed station, tools out of reach | Ergonomics, 5S, tools at point of use |
| Defects | No standard, human error, uncalibrated instruments | Standardized work, poka-yoke, quality at the source |
Notice that the same cause appears in more than one row. A large batch, for example, creates overproduction, inventory and transportation at once.
Waste outside the factory, and muda, mura and muri
Muda is only one of the three "Ms". Mura is unevenness of the workload and muri is overburden of people and machines. The three feed each other: variation (mura) creates spikes of overburden (muri), and overburden creates errors and waiting (muda). The difference is explained in muda, mura and muri.
The same wastes exist outside the factory. In an office, overproduction is the report nobody reads, waiting is the approval sitting in an inbox, motion is hunting for a file and defects are reworking an order with wrong data. The vocabulary changes, the logic does not.
Why overproduction is the worst
The Lean Enterprise Institute (LEI) calls overproduction the worst waste because it feeds the other six. Producing too much creates inventory, which requires transport and motion, hides defects that become rework and creates waiting elsewhere.
That is why lean prefers pull production with kanban over pushing production from a forecast: you only make what the customer, or the next process, has consumed.
Attacking overproduction means looking at the cause. Large batches come largely from slow changeovers and volume targets. Shortening changeovers, measuring flow instead of volume and releasing orders only when there is consumption also bring down the inventory, transportation and waiting that depend on it.
Worked example: a 20-minute cycle
Before the math, a classification rule. The LEI separates work into two types, and whatever is left is pure waste:
- Value creating: the movements that transform the product, such as welding, drilling and painting.
- Incidental: what the operator must do under current conditions but adds no value, such as fetching parts. It only shrinks by changing the workstation.
- Pure waste: neither of the two. It can be removed now, almost always without investment.
Illustrative example. An assembly station was observed for one full cycle of 20 minutes per assembly. Each activity was timed and classified. The 100% inspection and the rework count as defects (correction) because they only exist because of the defect.
| Activity | Time | Class | Waste |
|---|---|---|---|
| Assemble and weld the unit | 6 min | Value creating | - |
| Fetch parts from the warehouse | 3 min | Incidental | Transportation |
| Look for the wrench on the panel | 2 min | Incidental | Motion |
| Wait for the forklift | 4 min | Pure waste | Waiting |
| Inspect 100% of parts at the end | 3 min | Pure waste | Defects |
| Rework parts with burrs | 2 min | Pure waste | Defects |
| Class | Minutes | % of cycle |
|---|---|---|
| Value creating | 6 | 30% |
| Incidental | 5 | 25% |
| Pure waste | 9 | 45% |
| Total | 20 | 100% |
Value share: 6 ÷ 20 = 30%. Removing only the pure waste (9 min), the cycle drops to 20 − 9 = 11 minutes and the value share rises to 6 ÷ 11 = 54.5%.
In a 440-minute shift, the station goes from 440 ÷ 20 = 22 to 440 ÷ 11 = 40 assemblies, provided it is the bottleneck and the downstream flow keeps up. The 5 incidental minutes are left for the second round, because they require changing the workstation.
How to find and eliminate waste, step by step
- Pick one process and go to the place: a gemba walk is the most direct way to see the real work.
- Observe one full cycle with a stopwatch and paper, noting each activity and its time.
- Classify each line: value creating, incidental or pure waste, and name the type of waste.
- Total by class and calculate the value share. To see the whole flow, use value stream mapping.
- Attack pure waste first. For incidental work, change the station: tools at the point of use, parts at the right height, 5S.
- Measure before and after and record the gain in a kaizen cycle.
To prioritize across several stations, add up the pure waste time by type and sort from largest to smallest, as in a Pareto chart. Usually two or three types hold most of the loss, and that is where the first effort pays most. Do it with the people who run the station: nobody knows better where time is lost.
Common mistakes
- Treating the list as an end in itself and spending the meeting debating whether something is waiting or motion.
- Seeing waste only on the shop floor and forgetting the office, purchasing and engineering.
- Cutting "waste" from people's work without changing the station, which only shifts the effort.
- Estimating times from how the process should be instead of watching it on site.
- Removing waiting at a machine that is not the bottleneck and gaining only inventory.
- Confusing incidental work with pure waste and blaming the operator for something the station forces.
- Not standardizing the improvement: without standardized work, the waste comes back within weeks.
Next step
Pick one station today and time a full cycle. Fill in a table like the one in the example and calculate the value share. Attack the largest pure waste item and measure again in a week. Then repeat at the neighboring station: the table gets faster to fill in each round, and the team starts to see waste without a stopwatch.
Frequently asked questions
What are the 8 wastes of Lean?
Defects, overproduction, waiting, non-utilized talent, transportation, inventory, motion and extra processing, remembered as DOWNTIME. Ohno's original list has seven, without non-utilized talent.
What does muda mean?
Muda is the Japanese word for waste: any activity that consumes resources without adding value for the customer.
What is the worst of the wastes?
Overproduction, because it creates inventory and hides defects, waiting and unnecessary motion.
What is the 8th waste?
Non-utilized talent: not using people's ideas, skills and experience. It is a later addition, not part of Ohno's original list.
What is the difference between muda, mura and muri?
Muda is waste, mura is unevenness of the workload and muri is overburden of people or machines.
What is TIMWOODS?
An English mnemonic for the wastes: Transport, Inventory, Motion, Waiting, Overproduction, Over-processing, Defects and Skills.
How do you calculate the value-added share?
Divide the value creating time by the total cycle time. In the map example, 6 minutes out of 20 is 30%.
Who created the 7 wastes?
Taiichi Ohno, the Toyota engineer who was one of the creators of the Toyota Production System.
Sources
- Lean Enterprise Institute. What are the 7 Wastes in Lean? Lean Lexicon. https://www.lean.org/lexicon-terms/seven-wastes/
- Lean Enterprise Institute. Waste. Lean Lexicon. https://www.lean.org/lexicon-terms/waste/
- OHNO, T. Toyota Production System: Beyond Large-Scale Production. Productivity Press, 1988.
- WOMACK, J. P.; JONES, D. T. Lean Thinking. Free Press.
Know where the waste is hiding?
The next step is organizing the workstation. Download the free "5S in Practice" e-book.
Download the 5S e-book
About the author
Lean Manufacturing & Behavioral Management Specialist
Over 20 years in the automotive and metalworking industries (GM and Dana), Lean Manufacturing practitioner since 2006. SENAI instructor and mentor in Brazil’s Brasil Mais Produtivo program, delivering consulting, training and audits for 50+ companies, combining quality, productivity and people development.