- What the Theory of Constraints is
- Bottleneck vs. constraint: what is the difference
- Worked example: a four-step line
- How to find the bottleneck
- The five focusing steps
- Drum, buffer and rope
- The three TOC measures: throughput accounting
- TOC vs. lean and Six Sigma
- Common mistakes
- Next step
- Frequently asked questions
What the Theory of Constraints is
The Theory of Constraints (TOC) is a management philosophy and a set of tools created by the Israeli physicist Eliyahu Goldratt. It became widely known through the 1984 novel The Goal, written with Jeff Cox. The core idea is simple: every system has at least one constraint that limits its output, and only improving the constraint improves the system.
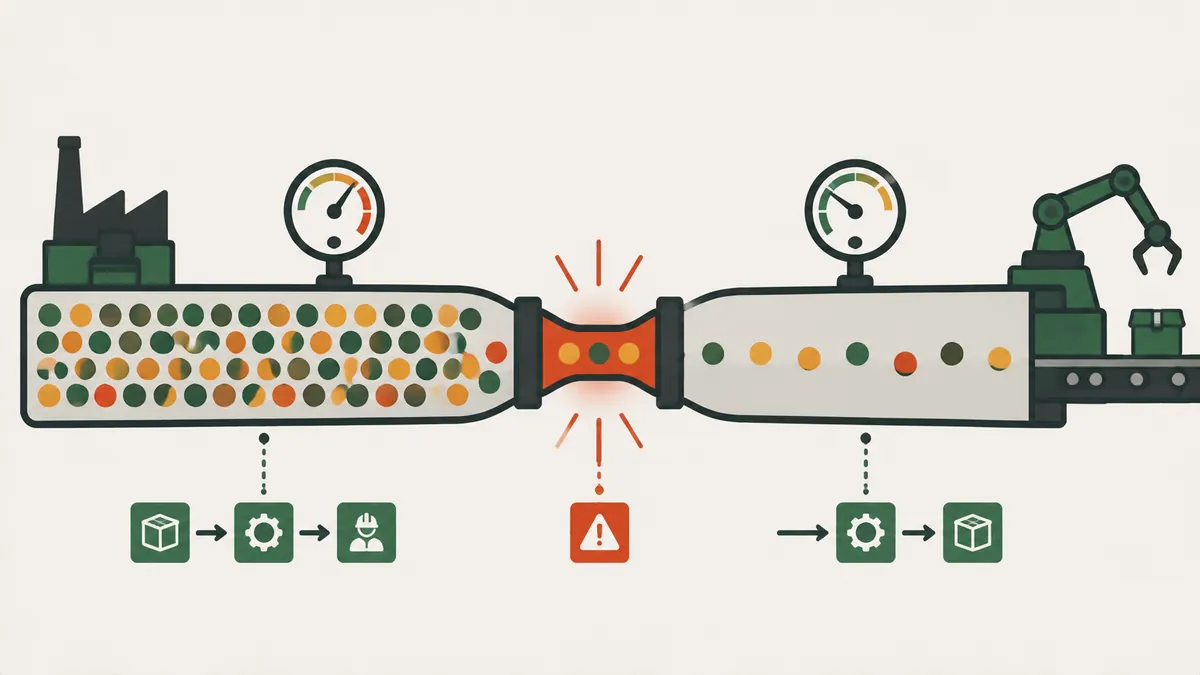
In a plant, the constraint is usually the bottleneck: the step with the lowest capacity. A line can only deliver what its slowest step can deliver. An hour lost at the bottleneck is an hour lost for the whole plant, while an hour gained anywhere else mostly turns into extra inventory.
TOC began in manufacturing, but it applies to any workflow: a job shop, a construction site, an engineering department or a service desk. Wherever there is a sequence of steps, one step sets the pace. Seeing which one it is lets you stop spreading effort thin and focus improvement where it actually raises results.
Bottleneck vs. constraint: what is the difference
On the shop floor, bottleneck and constraint are often used as synonyms. To be precise, the bottleneck is the physical capacity constraint: the resource whose capacity is lower than demand. But the constraint can be somewhere else.
| Type of constraint | Where it shows up | Example |
|---|---|---|
| Physical (bottleneck) | A machine, station or crew with the lowest capacity | A welder at 35 parts per hour between faster steps |
| Market | Demand is lower than plant capacity | The line could make more, but orders are missing |
| Policy | A rule, norm or habit that limits flow | Large minimum lot sizes, slow approvals, a break that stops the whole line |
| Supply | Material that arrives late or incomplete | Sheet metal delivered in weekly lots |
This classification is a practical way to organize the idea, not a single rule shared by all authors. What matters is knowing the constraint today, because that is where every effort pays off the most.
Worked example: a four-step line
Take an illustrative line, on an 8-hour shift, that processes the same part in four steps. The numbers are made up for the example.
| Step | Capacity (parts per hour) | Capacity in 8 hours (parts) |
|---|---|---|
| Cutting | 60 | 480 |
| Welding | 35 | 280 |
| Painting | 50 | 400 |
| Assembly | 45 | 360 |
Welding has the lowest capacity, 35 parts per hour, so it is the bottleneck. On top of that, it only runs 7 of the 8 hours, because it loses 1 hour to lunch, tool changes and waiting for material. The actual output of the line is 35 × 7 = 245 parts per day.
If cutting runs the whole shift at 60 parts per hour, it makes 480 parts. Welding consumes 245. That leaves 480 − 245 = 235 parts per day of work in process in front of the bottleneck. This inventory does not turn into cash. It takes space, hides problems and stretches lead time.
Notice what the example teaches. Cutting has the highest capacity on the line, 60 parts per hour, and still it would be a mistake to invest there. Painting, at 50, does not limit anything today either. Any improvement in those two steps would leave the flow unchanged and the inventory larger. Attention belongs on welding.
How to find the bottleneck
No single sign is proof. Combine at least two and confirm with capacity data.
| Sign | How to check |
|---|---|
| Queue in front of the step | Count the parts waiting at each station over a few days |
| Cycle time above takt | Compare cycle time with takt time; the step that cannot keep up with demand is a candidate |
| The step that never stops | The step that works all the time while the following ones wait |
| Lowest capacity | Calculate the capacity of each step, as in the guide to production capacity |
| Flow map | Value stream mapping shows cycle time and inventory for each step side by side |
In the example, the queue of parts in front of welding and the lowest capacity point to the same place.
The five focusing steps
Goldratt proposed a cycle of five steps. Here is each one applied to the example.
- Identify the constraint. Welding, at 35 parts per hour.
- Exploit the constraint. Get the most out of what already exists, with no investment. Stagger lunch so welding does not stop, cut changeover time with SMED, deliver material on time and keep the machine available with TPM. By recovering the lost hour, welding runs 8 hours: 35 × 8 = 280 parts per day, which is 35 more (+14.3%).
- Subordinate everything else to the constraint. The other steps work at the pace of welding. Cutting stops making 480 parts and makes about 280, which ends the pile-up.
- Elevate the constraint. If that is still not enough, invest in capacity. A second station takes welding to 50 parts per hour. The constraint then moves to assembly, at 45 parts per hour: 45 × 8 = 360 parts per day.
- Repeat. Assembly is the new constraint, and the cycle starts again.
The result in the example: from 245 to 280 by exploiting alone, and to 360 after elevating. That is 115 more parts per day, or 46.9%.
Drum, buffer and rope
Drum-buffer-rope (DBR) is the TOC scheduling method that makes the flow follow the constraint.
- Drum: the pace of the constraint, which sets the pace of the plant. In the example, 35 parts per hour at welding.
- Buffer: a protected reserve in front of the constraint so that it never waits. For example, 2 hours of welding consumption: 35 × 2 = 70 parts. The buffer is small and controlled, unlike inventory that grows without criteria.
- Rope: the signal that ties the release of material to the drum. Cutting only gets an order when welding consumes, much like pull production.
Inspection should sit before the constraint, so it does not spend precious time on parts that will be scrapped.
The three TOC measures: throughput accounting
TOC proposes judging decisions by three global measures, not by the efficiency of each department. This is often called throughput accounting.
| Measure | Definition | Question it answers |
|---|---|---|
| Throughput | The rate at which the system generates money through sales | How much comes in? |
| Inventory | Money invested in items the company intends to sell | How much is tied up? |
| Operating expense | Money spent to turn inventory into throughput | How much does it cost to run? |
An improvement is worth it only if it raises throughput, lowers inventory or lowers operating expense. Raising the efficiency of a machine that is not the bottleneck does none of the three.
TOC vs. lean and Six Sigma
According to the Lean Enterprise Institute, TOC focuses on removing or managing constraints to increase output, while lean focuses on identifying and eliminating waste in the value stream. Both stress the whole system, not isolated parts.
| Aspect | TOC | Lean | Six Sigma |
|---|---|---|---|
| Focus | The system constraint | Waste in the flow | Process variation |
| Key question | What limits the result? | What adds no value? | Why does the result vary? |
| When to use first | To choose where to act | To work on the whole flow | To stabilize a process |
In practice they combine well: TOC says where to attack first, while lean tools and the bottleneck's OEE show how and how much it improved. Measuring OEE on the constraint machine is usually the best first metric.
A useful rule of thumb: use TOC to decide where to improve, lean to decide what to eliminate in the flow, and statistical control to keep the process stable afterward. One tool does not replace the others.
Common mistakes
- Improving where there is no bottleneck. It yields inventory, not output.
- Chasing equal capacity at every step. TOC aims to balance flow, not capacity. Some spare capacity outside the constraint is healthy.
- Letting the bottleneck wait. A lack of material, operators or tooling at the bottleneck is expensive.
- Forgetting step 5. After an improvement, the constraint moves. Whoever does not go back to step 1 optimizes the wrong constraint.
- Looking only at machines. Many constraints are policies: rules, lot sizes and priorities.
Next step
Pick one line and follow this one-week routine.
- Calculate the capacity of each step and confirm the bottleneck with the queue and the cycle time.
- Measure the hours the bottleneck really runs and list the avoidable stops.
- Attack the biggest stop with a simple action that needs no investment.
- Cut material release down to the pace of the bottleneck.
- Reassess in a week: did the constraint move?
Frequently asked questions
What is the difference between a bottleneck and a constraint?
A bottleneck is the physical capacity constraint. A constraint can also come from the market, from policy or from supply.
What are the five focusing steps of the Theory of Constraints?
Identify, exploit, subordinate, elevate the constraint, and go back to step 1 when it moves.
What is drum-buffer-rope?
It is the TOC scheduling method: the drum sets the pace of the constraint, the buffer protects it and the rope ties material release to that pace.
How do you find the bottleneck on a line?
Look for the queue of parts in front of a step, a cycle time above takt and the lowest calculated capacity.
Are TOC and lean competing approaches?
No. TOC tells you where to act first, and lean provides the tools to act.
Who created the Theory of Constraints?
Eliyahu Goldratt, who popularized it in the 1984 book The Goal, written with Jeff Cox.
Why does improving a non-bottleneck step not help?
Because line output is capped by the constraint. A gain elsewhere turns into work-in-process inventory.
Sources
- Lean Enterprise Institute. Theory of Constraints. Lean Lexicon. https://www.lean.org/lexicon-terms/theory-of-constraints/
- GOLDRATT, E. M.; COX, J. The Goal: A Process of Ongoing Improvement. Great Barrington: North River Press, 1984.
- GOLDRATT, E. M. What Is This Thing Called Theory of Constraints and How Should It Be Implemented? Great Barrington: North River Press, 1990.
Want to locate the bottleneck in your process?
Read the complete Value Stream Mapping guide and see cycle time and inventory for each step side by side.
Read the article
About the author
Lean Manufacturing & Behavioral Management Specialist
Over 20 years in the automotive and metalworking industries (GM and Dana), Lean Manufacturing practitioner since 2006. SENAI instructor and mentor in Brazil’s Brasil Mais Produtivo program, delivering consulting, training and audits for 50+ companies, combining quality, productivity and people development.