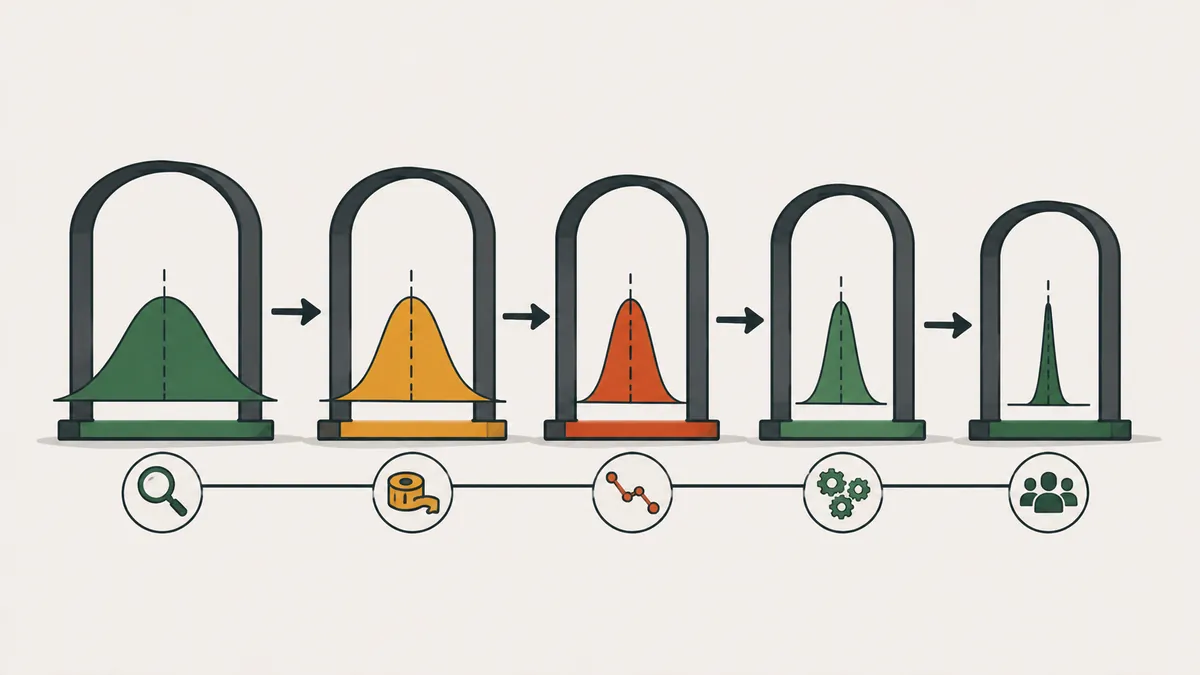
What Six Sigma is
Six Sigma is a management approach that reduces defects and variation in processes through a structured method and statistical analysis. The name comes from the Greek letter sigma (σ), the symbol for standard deviation, which measures how much a process varies.
A process can hit its average and still make defects, because some parts fall outside the tolerance. Cutting the spread pulls every part closer to the target. That is why Six Sigma looks at variation, not only at the mean.
By the method's convention, a "six sigma" process produces 3.4 defects per million opportunities (DPMO). That figure already includes a 1.5 sigma shift of the mean over time, an assumption the method adopts. Motorola coined the term in the 1980s and many companies adopted it later. The Lean Enterprise Institute lists the term in its lexicon.
The starting point is always the customer. The method turns customer requirements into critical-to-quality characteristics (CTQs), measures how well the process meets them and only then picks an action. Without that translation, teams end up optimizing what is easy to measure instead of what matters.
How to calculate DPU, DPMO and sigma level
Three counts are enough: units inspected, defect opportunities per unit and defects found. An opportunity is a characteristic that can go wrong and that the customer notices. Fix the list before you count.
| Metric | Formula | In the example |
|---|---|---|
| Units (U) | Parts inspected | 5,000 shafts |
| Opportunities per unit (O) | Characteristics that can fail | 4 |
| Defects (D) | Total nonconformities | 60 |
| DPU | D ÷ U | 60 ÷ 5,000 = 0.012 |
| DPMO | D ÷ (U × O) × 1,000,000 | 60 ÷ 20,000 × 1,000,000 = 3,000 |
| Yield per opportunity | 1 - D ÷ (U × O) | 1 - 0.003 = 99.7% |
With the DPMO, look up the conversion table. It uses the 1.5 sigma shift.
| Sigma level | DPMO | Yield |
|---|---|---|
| 2 | 308,538 | 69.1% |
| 3 | 66,807 | 93.3% |
| 4 | 6,210 | 99.38% |
| 5 | 233 | 99.977% |
| 6 | 3.4 | 99.99966% |
A DPMO of 3,000 falls between 4 and 5 sigma. In a spreadsheet, the formula is =NORM.S.INV(1-DPMO/1000000)+1.5, which gives about 4.25. Many Six Sigma calculators and Minitab do the same conversion.
Two cautions. DPU counts defects, and one part can have several. To count defective parts, use first pass yield, covered in first pass yield and RTY. And if you raise the number of opportunities just to inflate the denominator, the sigma level improves on paper while the customer notices nothing.
The five DMAIC phases
DMAIC is the sequence used in Six Sigma improvement projects: Define, Measure, Analyze, Improve and Control. Each phase ends only when it delivers what the next one needs.
| Phase | Key question | Common tools | Deliverable |
|---|---|---|---|
| Define | What is the problem, for which customer and with what goal? | Project charter, SIPOC, voice of the customer | Problem, scope and goal |
| Measure | What is the current performance, and can we trust the measurement? | Data collection plan, measurement system analysis and Gauge R&R, baseline | Current DPMO and reliable data |
| Analyze | Which causes explain the variation? | Pareto, fishbone, 5 Whys, hypothesis tests, regression | Verified root causes |
| Improve | Which solution attacks the cause? | Designed experiments, pilot, poka-yoke | Tested solution |
| Control | How do we hold the gain? | Control charts, standard, reaction plan | Sustained gain |
After improving, confirm process capability with Cp and Cpk. A short-term six sigma process has a Cp of 2.0.
Define prevents the most common mistake: starting to solve before knowing the problem. The project charter states the problem in one sentence, the scope (what is in and out), the numeric goal and the deadline. SIPOC shows suppliers, inputs, process, outputs and customers on one page and helps everyone agree on the scope.
Measure has two jobs. The first is proving the measurement is reliable, because bad data leads to bad conclusions. The second is building the baseline: current DPMO, mean and spread, split by shift, machine and lot. Without a baseline you cannot say that anything improved.
Analyze separates causes from symptoms. Start with a Pareto chart to find the few defects that make up most of the problem. Then use a fishbone diagram and 5 Whys to raise hypotheses, and confirm them with data through charts, hypothesis tests or regression. A cause that has not been verified is still an opinion.
Improve tests the solution at small scale before rolling it out. When several factors are in play, design of experiments (DOE) shows which ones matter most. Whenever possible, prefer a solution that prevents the error, such as poka-yoke, over one that depends on operator attention.
Control makes the gain stick. Update the work standard, train the people who run the process, install the control chart at the station and define what to do when a point goes outside the limit. Only then is the project closed and handed to the process owner.
Worked example: from 3,000 to 1,350 DPMO
This is an illustrative example with invented numbers, made to teach the calculation. A line machines shafts with 4 critical characteristics: diameter, length, surface roughness and concentricity.
- Define: complaints about shafts out of specification. Goal: bring the DPMO from 3,000 down to 1,500 or less.
- Measure: the Gauge R&R study gave 8% of the tolerance. As a rule of thumb, below 10% the measurement system is acceptable and above 30% it is not. Among 5,000 shafts, 60 defects were found: a DPMO of 3,000.
- Analyze: the Pareto chart shows that diameter accounts for 60% of the defects. The data indicate that variation grows in the first two hours after a tool change.
- Improve: tool presetting and a check of the first three parts, tested on one shift before extending to the others.
- Control: an X-bar and R chart at the station, an updated standard on all three shifts and a reaction plan for points outside the limits.
| Defect cause | Before | After |
|---|---|---|
| Diameter out | 36 | 3 |
| Roughness | 12 | 12 |
| Length | 8 | 8 |
| Concentricity | 4 | 4 |
| Total defects | 60 | 27 |
| DPMO | 3,000 | 1,350 |
| Sigma level (approx.) | 4.25 | 4.5 |
The final calculation: 27 ÷ 20,000 × 1,000,000 = 1,350 DPMO, a 55% reduction (from 3,000 to 1,350). The goal was beaten. Roughness now accounts for 44% of the 27 defects and becomes the target of the next cycle.
Note what the example teaches. Diameter was 60% of the defects (36 out of 60), so attacking it alone cut the total almost in half. Spending the same effort on concentricity, which had only 4 defects, would have been a waste. The Pareto chart decides where the team's time goes.
Belts and project roles
Six Sigma organizes training in belts. The grouping below is a practical organization; names and requirements vary between companies and certifying bodies.
| Belt or role | What they do |
|---|---|
| White Belt | Knows the vocabulary and supports data collection |
| Yellow Belt | Takes part in the project and runs assigned tasks |
| Green Belt | Leads smaller projects, usually part time |
| Black Belt | Leads complex projects and coaches Green Belts |
| Master Black Belt | Trains people and sets the program strategy |
| Sponsor (champion) | Chooses the project, releases resources and removes barriers |
The LEI warns that certification has become so widespread that it is hard to judge its quality. A certificate does not prove ability. A record of completed projects with measured results counts for more.
Six Sigma, lean and DMADV: when to use each
| Approach | Focus | Use when |
|---|---|---|
| Six Sigma (DMAIC) | Variation and defects in an existing process | The defect persists and the cause is not obvious |
| Lean | Waste, flow and lead time | Waiting, inventory and rework are visible |
| DMADV (DFSS) | Design of a new product or process | There is no process yet to improve |
In practice, companies combine the two. See the full comparison in Lean vs Six Sigma.
When Six Sigma is worth it
Six Sigma pays off when a defect persists, the cause is not evident and good data can be collected. It demands time, training and statistical discipline, so it makes no sense for problems whose cause is already clear. In those cases a direct action, a poka-yoke or a short PDCA cycle solves it faster.
For queues, high inventory and long lead times, lean tools are usually faster. For dimensional variation, leaks, paint defects or a data entry error that will not go away, DMAIC is the natural choice. In many plants, lean cleans up the flow first and Six Sigma goes after the defects that remain.
Common mistakes
- Analyzing data without validating the measurement system.
- Choosing a project too big to close in a few months.
- Setting a goal without a baseline.
- Inflating opportunities to improve the sigma level.
- Ending without the Control phase and watching the gain disappear.
- Running statistical tests without understanding the process at the gemba.
The last mistake deserves attention. Statistics answers "what" and "how much", but whoever goes to the workstation, watches the operation and talks to the operator finds the "why". The best projects combine both.
Next step
Pick one recurring defect and do the math: units, opportunities, defects, DPMO. Validate the measurement before you analyze anything. Then set up a small project with a numeric goal and a deadline of a few months, and follow DMAIC through to the Control phase.
Frequently asked questions
What is Six Sigma?
It is an improvement approach that reduces variation and defects through a structured method and statistics. Its projects follow the DMAIC sequence.
What does 3.4 DPMO mean?
It means 3.4 defects per million opportunities, the performance of a six sigma process by the method's convention, with a 1.5 sigma shift.
What does DMAIC stand for?
Define, Measure, Analyze, Improve and Control. It is the sequence of Six Sigma improvement projects.
How do you calculate DPMO?
DPMO = defects ÷ (units × opportunities per unit) × 1,000,000. With 60 defects in 5,000 parts and 4 opportunities, that is 3,000 DPMO.
What is the difference between DPU and DPMO?
DPU is defects per unit (60 ÷ 5,000 = 0.012). DPMO is defects per million opportunities and lets you compare different processes.
Is Six Sigma the same as lean?
No. Six Sigma attacks variation and defects, while lean attacks waste and flow. The two combine in Lean Six Sigma.
Do I need statistics to use Six Sigma?
Yes, mainly in the Measure and Analyze phases. For simple cases, Pareto charts and control charts already solve a lot.
Who created Six Sigma?
Motorola coined the term in the 1980s to describe its quality program.
Sources
- Lean Enterprise Institute. Six Sigma. Lean Lexicon. https://www.lean.org/lexicon-terms/six-sigma/
- PANDE, P. S.; NEUMAN, R. P.; CAVANAGH, R. R. The Six Sigma Way. New York: McGraw-Hill, 2000.
- MONTGOMERY, D. C. Introduction to Statistical Quality Control. Hoboken: Wiley.
- GEORGE, M. L. Lean Six Sigma: Combining Six Sigma Quality with Lean Speed. New York: McGraw-Hill, 2002.
Want the tools ready to use?
Download the free "Problem Solving Kit" e-book, with PDCA, A3, 5 Whys and Ishikawa.
Download the e-book
About the author
Lean Manufacturing & Behavioral Management Specialist
Over 20 years in the automotive and metalworking industries (GM and Dana), Lean Manufacturing practitioner since 2006. SENAI instructor and mentor in Brazil’s Brasil Mais Produtivo program, delivering consulting, training and audits for 50+ companies, combining quality, productivity and people development.