What is takt time
Takt time is the available production time divided by customer demand. It tells you how often one unit must be completed so that output keeps up with orders, neither faster nor slower.
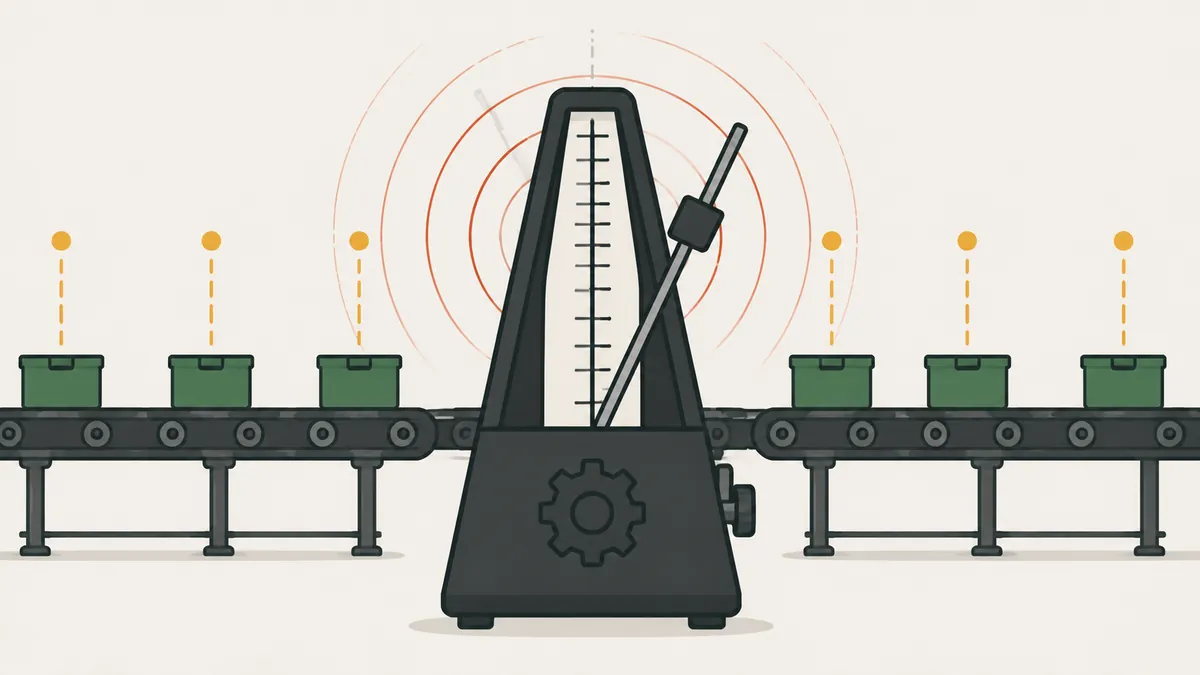
The word comes from the German Takt, meaning meter or beat, the regular interval in music. The Lean Enterprise Institute (LEI) describes it as the pace that matches production to demand, which is why it is called the heartbeat of a lean system. According to the LEI, the idea was used in the German aircraft industry in the 1930s and widely adopted within Toyota in the 1950s.
Takt time does not measure how fast your process runs. It measures how fast the customer needs product. It is an external reference, and that is what makes it useful: it shows whether the line is running above or below what the market requires.
In practice, takt supports four decisions: how many operators the line needs, which stations are bottlenecks, whether production is ahead of or behind orders, and what rhythm the standardized work should follow. A simple board comparing the units that should be done each hour with the units actually made makes takt visible to the team without long reports.
Takt time formula
Takt time = available time ÷ customer demand
Both variables must cover the same period, such as per day or per shift. The result comes out in the time unit you used: seconds per unit or minutes per unit.
| Variable | How to define it | What does not belong |
|---|---|---|
| Available time | Shift time minus planned stops (meals, breaks, daily meeting, stretching) | Breakdowns, material shortages and unplanned changeovers |
| Customer demand | Quantity the customer needs in the period, in units per day or per shift | Your own safety stock and production targets without orders |
Breakdowns and material shortages are not deducted from available time. They are losses the line must remove to meet takt. If you deduct them, takt looks higher than it should and the problem disappears from the calculation.
The classic LEI example: a plant runs 480 minutes a day with demand of 240 units a day. Takt time is 2 minutes per unit.
Worked example: a 72-second takt
Illustrative example for an assembly line with two shifts. The data belong to the exercise, not to a real company.
| Item | Value |
|---|---|
| Shifts per day | 2 shifts of 8 h = 960 min |
| Planned stops | 2 × 60 min (meals and breaks) = 120 min |
| Available time | 960 − 120 = 840 min = 50,400 s |
| Daily demand | 700 units |
| Takt time | 50,400 ÷ 700 = 72 s per unit |
If demand comes by month, convert it first: 15,400 units over 22 working days gives 15,400 ÷ 22 = 700 units per day. If demand rises to 840 units a day, takt drops to 50,400 ÷ 840 = 60 seconds. Takt follows demand, so it has to be reviewed regularly. According to the LEI, Toyota typically reviews it monthly, with a tweak every 10 days.
To express it in minutes, divide by 60: 72 s is 1.2 min per unit.
Takt time vs cycle time vs lead time
The three terms show up together and get mixed up all the time. Only the first comes from the customer.
| Term | Source | Question it answers | In the example |
|---|---|---|---|
| Takt time | Customer demand | How often must a unit come out? | 72 s |
| Cycle time | The operation | How long does the station take to make one unit? | 45 to 80 s, depending on the station |
| Lead time | The whole flow | How long does a unit take from entry to exit? | Depends on inventory between steps |
When a station's cycle time is above takt, that station is the bottleneck and the line cannot meet demand. When it is far below takt, you have idle time or overproduction, the worst of the wastes of lean. To shorten the total time, see lead time: definition, calculation and reduction.
There is also pitch, used to control production in blocks: takt multiplied by the number of units in one container. With 10-unit containers, pitch is 72 × 10 = 720 s, or 12 minutes.
How to use takt time to balance a line
The most common use of takt is to distribute work across stations. The routine is short.
- Calculate takt (72 s in the example).
- Time each station's cycle several times and use a representative value.
- Chart the stations as bars with a horizontal line at takt.
- Move tasks from stations above takt to stations below it.
- Record the new split as standardized work.
| Station | Cycle before (s) | Cycle after (s) | Status |
|---|---|---|---|
| 1 | 55 | 55 | Below takt |
| 2 | 68 | 68 | Below takt |
| 3 | 80 | 70 | Was 8 s above takt |
| 4 | 62 | 62 | Below takt |
| 5 | 45 | 55 | Received 10 s from station 3 |
| Total | 310 | 310 | Total work did not change |
The theoretical minimum number of operators is the sum of cycle times divided by takt, rounded up: 310 ÷ 72 = 4.3, so 5 operators. With 5 operators, balance efficiency is 310 ÷ (5 × 72) = 310 ÷ 360 = 86.1%. If demand rises and takt falls to 60 s, the math becomes 310 ÷ 60 = 5.2, and the line needs 6 operators or less work content. The full topic is in assembly line balancing.
When takt time works and when it does not
Takt is most useful where demand is repetitive and flow is continuous: assembly lines, production cells and stable-volume processes. There it organizes everyone's work around a single rhythm.
In high-mix, low-volume environments, such as a make-to-order machine shop, the takt of a single item says little, because each order has a different routing and time. There takt is calculated by product family, or workload per work center is used instead. This is practical guidance, not a fixed rule, and each plant adapts it to its flow.
Takt also connects to pull production. In kanban, the replenishment rhythm follows customer consumption, and takt translates that consumption into time. Without a defined rhythm, a plant tends to run at the pace of its fastest machine, and inventory piles up between steps.
Several products, shifts and stops
With more than one product on the same line, add the demands together. If product A needs 400 units a day and B needs 300, total demand is 700 and takt stays at 72 s. What changes is the work content of each model, and the production sequence comes into play. To mix models without breaking the rhythm, use heijunka.
Three practical cautions for the calculation:
- Use customer demand, not machine capacity or the plant target.
- Calculate per process that serves the same flow. A machining cell and an assembly cell for the same product share the takt.
- For processes with cycle time close to takt, design a target cycle below takt to absorb small stops. This is a design practice, not part of the formula.
To relate the rhythm to installed capacity, see production capacity.
Common mistakes in calculating and using takt
- Deducting breakdowns from available time. Takt gets larger than it should and the problem vanishes from the numbers.
- Using the production target instead of customer demand.
- Mixing periods: monthly demand divided by daily time.
- Confusing takt with cycle time and treating takt as machine speed.
- Calculating once and never revisiting while demand changes.
- Holding the operator to takt without removing the causes of stoppages.
Next step
Pick one line and calculate its takt today, using last week's real demand and the shift's available time. Then time each station and chart the bars with the takt line. The first station above the line is your starting point. Record the result and review the calculation the following week.
Frequently asked questions
What is takt time?
It is the available production time divided by customer demand. It shows the interval at which a unit must be completed to meet orders.
What is the takt time formula?
Takt time = available time ÷ customer demand, with both figures covering the same period.
Do machine breakdowns count in takt time?
No. Only planned stops such as meals and breaks are deducted. Breakdowns are losses the line must remove to meet takt.
What is the difference between takt time and cycle time?
Takt comes from customer demand. Cycle time comes from the operation and measures how long a station takes per unit. If cycle time exceeds takt, the station is a bottleneck.
Are takt time and lead time the same thing?
No. Takt is the output pace the customer requires. Lead time is the total time a product takes to move through the process.
How do you calculate takt time with monthly demand?
Divide monthly demand by working days to get daily demand, then use one day of available time. Example: 15,400 ÷ 22 = 700 units per day.
How often should takt time be reviewed?
Whenever demand changes significantly. According to the LEI, Toyota typically reviews it monthly, with a tweak every 10 days.
Sources
- Lean Enterprise Institute. Takt Time. Lean Lexicon. https://www.lean.org/lexicon-terms/takt-time/
- Lean Enterprise Institute. Cycle Time. Lean Lexicon. https://www.lean.org/lexicon-terms/cycle-time/
- ROTHER, M.; SHOOK, J. Learning to See: Value Stream Mapping to Add Value and Eliminate Muda. Cambridge: Lean Enterprise Institute.
Want real pull production?
Download the free pull production e-book, with kanban, supermarkets and leveling.
Download the e-book
About the author
Lean Manufacturing & Behavioral Management Specialist
Over 20 years in the automotive and metalworking industries (GM and Dana), Lean Manufacturing practitioner since 2006. SENAI instructor and mentor in Brazil’s Brasil Mais Produtivo program, delivering consulting, training and audits for 50+ companies, combining quality, productivity and people development.