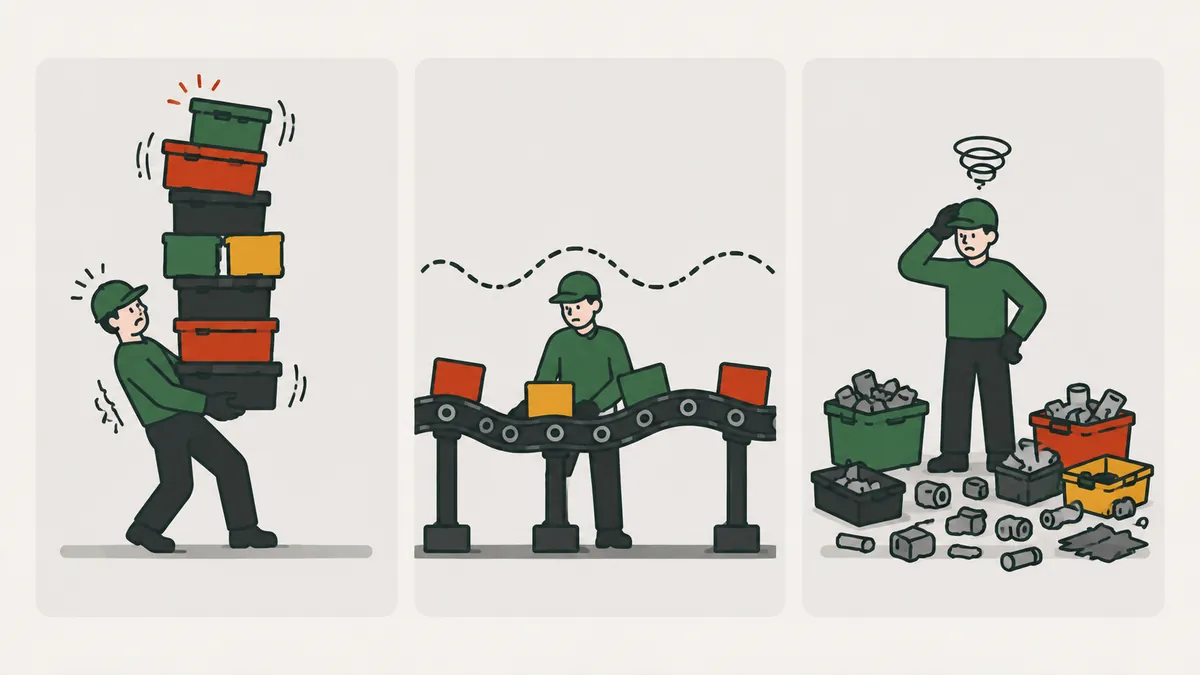
What muda, mura and muri mean
Muda, mura and muri are three Japanese words used in the Toyota Production System for the three kinds of loss that get in the way of good work: waste, unevenness and overburden. Lean practitioners call them the 3 Ms.
If you only know muda, you see a third of the picture. The three travel together, and removing only the visible waste often pushes the loss somewhere else in the process. This guide defines each term, shows how one feeds the next, works through an example with numbers and suggests where to start.
The 3 Ms side by side
| Term | Meaning | What it looks like | Example |
|---|---|---|---|
| Muda | Waste: any activity that consumes resources without creating value for the customer | Waiting, idle inventory, rework, needless motion | Parts moved several times between operations |
| Mura | Unevenness: variation in volume or pace of work | Peak days followed by empty days, queues that appear and vanish | Slow start to the month and a rush at the end |
| Muri | Overburden: pushing people or equipment beyond natural limits | Recurring overtime, machines above rated speed, awkward postures | Equipment pushed to make up for a late start |
Each M has a different symptom, so each needs a different countermeasure. A daily target board does not fix overburden, and a 5S campaign does not fix orders that arrive in waves.
Type 1 and type 2 muda
The Lean Enterprise Institute (LEI) splits muda into two groups to help with prioritizing.
- Type 1: activities that add no value but cannot be eliminated right now. The classic example is rework after a paint booth, needed until the painting process can deliver the finish on its own.
- Type 2: activities that can be eliminated quickly with kaizen, such as moving products and inventory several times between steps.
Type 2 is the quick win. Type 1 takes a project and investment. The classic waste categories, such as waiting, transportation and overproduction, are covered in the wastes of lean. Many authors list eight, adding unused talent. That is a practical way to organize the list, not a single fixed rule.
How the three feed each other
The 3 Ms form a loop. Uneven demand (mura) creates weeks of rushing, with overtime and machines pushed hard (muri). Overburden causes breakdowns, errors and rework, which are waste (muda). And to protect itself from the swings, the plant builds inventory, which is also muda.
That is why attacking only muda tends to give short-lived results. Taking waste out of an uneven, overloaded process creates new problems somewhere else. Often the right move is to start with mura and level the load with heijunka, because that reduces overburden and a good part of the waste at the same time.
Muri is not only a machine issue. In people it shows up as constant rushing, repetitive physical effort, awkward postures and extended shifts, with consequences for safety, quality and turnover. In equipment it shows up as running above rated speed, deferred maintenance and improvised adjustments to recover lost time. In both cases the cost arrives later, as an injury, a defect or a breakdown, and it almost never lands on the books of the day the pressure was applied.
Mura, for its part, comes from familiar causes: orders bunched at month end by sales targets, large batches that release work in waves, material shortages that delay the start and absenteeism with no coverage plan. Talking with sales and planning about that pattern is usually more effective than adjusting the plant to every peak.
Worked example: an uneven week
Illustrative example. A cell makes 100 units per day on an 8-hour shift, or 12.5 units per hour (100 ÷ 8). The week's orders total 500 units, due by Friday, but they arrive unevenly. Production follows the orders as they come.
| Day | Orders | Load vs. capacity | Overtime (muri) | Idle capacity (muda) |
|---|---|---|---|---|
| Monday | 160 | 160% | 4.8 h | 0.0 h |
| Tuesday | 140 | 140% | 3.2 h | 0.0 h |
| Wednesday | 100 | 100% | 0.0 h | 0.0 h |
| Thursday | 60 | 60% | 0.0 h | 3.2 h |
| Friday | 40 | 40% | 0.0 h | 4.8 h |
| Week | 500 | average of 100 per day | 8.0 h | 8.0 h |
The math: Monday, (160 − 100) ÷ 12.5 = 4.8 h of overtime. Tuesday, (140 − 100) ÷ 12.5 = 3.2 h. Thursday, (100 − 60) ÷ 12.5 = 3.2 h idle. Friday, (100 − 40) ÷ 12.5 = 4.8 h idle. The same week carries 8.0 h of overburden and 8.0 h of unused capacity. The ratio of peak (160) to average (100) is 1.6.
Leveling it: if orders are released to the floor at 100 units per day, overtime drops to 0.0 h and so does idle time. Monday and Tuesday orders wait in a queue that never exceeds 100 units (60 on Monday, 100 on Tuesday and Wednesday, 60 on Thursday, 0 on Friday), and everything ships by Friday. Leveling only works when the due date allows that wait. If the customer demands the peak on the day, the answer is a small, deliberately sized finished-goods buffer.
Muda, mura and muri in other settings
The logic of the example holds outside the production cell. Here are three illustrative situations.
- Machining: scheduling releases all the long orders at the start of the week (mura). The department runs machines at their limit with no time for basic maintenance (muri). On Thursday a breakdown leaves parts waiting for the machine (muda).
- Shipping: every truck arrives at 4 p.m. (mura). Checkers rush, counting errors rise and so does the pressure on the crew (muri). The errors produce returns and rework (muda).
- Office: purchase requests are approved in a batch on Friday (mura). The buyer works through the pile in a hurry (muri) and repeats quotes because of missing data (muda).
In every case the starting point is the same: measure the pace of work across the day and the week before hunting for waste.
How to spot each M in your area
- Muri first: ask operators where the work is physically or mentally overloaded. Look for recurring overtime, machines above rated speed and complaints about fatigue.
- Mura next: record output by day, or by hour, for four weeks. Peaks and valleys point to unevenness in orders, scheduling or staffing.
- Muda last: watch one full cycle on site, on a gemba walk, and mark everything that does not transform the product.
The order is deliberate. Muri and mura point to causes; muda is largely the consequence. Takt time helps compare the pace of demand with the pace of production.
Also record what the numbers do not show. During the walk, ask each person what gets in the way of the work today and log the answers by M. A few visits are enough for patterns to appear: the same waiting point, the same crunch hour, the same station that always runs late.
Typical countermeasures for each M
| Loss | What to attack | Common tools |
|---|---|---|
| Muda | Waiting, inventory, motion, rework | 5S, continuous flow, kanban, value stream mapping |
| Mura | Swings in volume and mix | Heijunka, takt time, a conversation with sales about order patterns |
| Muri | Load beyond what people and machines can sustain | Standardized work, line balancing, ergonomics, TPM |
Kanban helps cap inventory and pull work at the customer's pace. Standardized work sets a load a person can sustain. Using all three fronts together is what keeps the gain.
Common mistakes
- Attacking only muda and ignoring the mura that produces it.
- Cutting headcount to remove waste and creating overburden for the people who stay.
- Confusing leveling with building to stock. Leveling spreads the load; any buffer is sized on purpose.
- Tracking only the monthly average and not the daily variation.
- Treating overtime as normal when it is a sign of muri.
Another frequent mistake is turning the 3 M diagnosis into an audit of people. The goal is to see the process. The people who run it are the best source of information and need to feel safe pointing out overburden.
Next step
Pick one process and record daily output for four weeks. Calculate the ratio of peak to average. The higher the ratio, the more unevenness there is to investigate. Ask the people who run the process where the overburden is, and only then list the wastes. Start with the unevenness and track overtime, which should fall as the load levels out.
Set one countermeasure per M and one metric for each: overtime hours per week (muri), peak-to-average ratio (mura) and waiting time between steps (muda). Review weekly, standing at the board, and only extend to another process when all three metrics are stable.
Frequently asked questions
What do muda, mura and muri mean?
They are Japanese terms from the Toyota Production System: muda is waste, mura is unevenness and muri is overburden. Together they are the 3 Ms.
What is the difference between mura and muri?
Mura is variation in the pace or volume of work. Muri is asking people or equipment to do more than their natural limit. Mura often causes muri.
What is the difference between type 1 and type 2 muda?
Type 1 adds no value but cannot be removed right away. Type 2 can be removed quickly with kaizen.
Which should I tackle first: muda, mura or muri?
Often mura, because leveling the load reduces overburden and part of the waste. The diagnosis should still look at all three.
Is muda the same as the 7 wastes?
The 7 wastes are the classic categories of muda. Muda covers any activity that consumes resources without creating customer value.
Is overtime a sign of muri?
Recurring overtime is a typical sign of overburden. Occasional overtime can be a conscious choice; as routine, it points to missing capacity or a badly spread load.
Does leveling production require inventory?
Not always. If the due date allows, orders wait in a queue and still ship on time. When the customer needs the peak on the day, a small finished-goods buffer may be needed.
Sources
- Lean Enterprise Institute. Waste. Lean Lexicon. https://www.lean.org/lexicon-terms/waste/
- Lean Enterprise Institute. Heijunka. Lean Lexicon. https://www.lean.org/lexicon-terms/heijunka/
- OHNO, T. Toyota Production System: Beyond Large-Scale Production. Productivity Press.
- LIKER, J. The Toyota Way: 14 Management Principles from the World's Greatest Manufacturer. McGraw-Hill.
Want to lead change on the shop floor?
Download the free Lean for Leaders e-book and learn to spot waste, unevenness and overburden in your own area.
Download the e-book
About the author
Lean Manufacturing & Behavioral Management Specialist
Over 20 years in the automotive and metalworking industries (GM and Dana), Lean Manufacturing practitioner since 2006. SENAI instructor and mentor in Brazil’s Brasil Mais Produtivo program, delivering consulting, training and audits for 50+ companies, combining quality, productivity and people development.