
What a fishbone diagram is
The fishbone diagram, also called the Ishikawa or cause-and-effect diagram, is a visual tool for organizing the possible causes of a problem. The problem (effect) sits at the fish's head and the causes are grouped on the bones by category.
It was popularized by Kaoru Ishikawa, a Japanese engineer and one of the central figures of quality control in Japan. The value is not the drawing itself but the structured conversation it forces: the team looks at every angle before settling on an explanation.
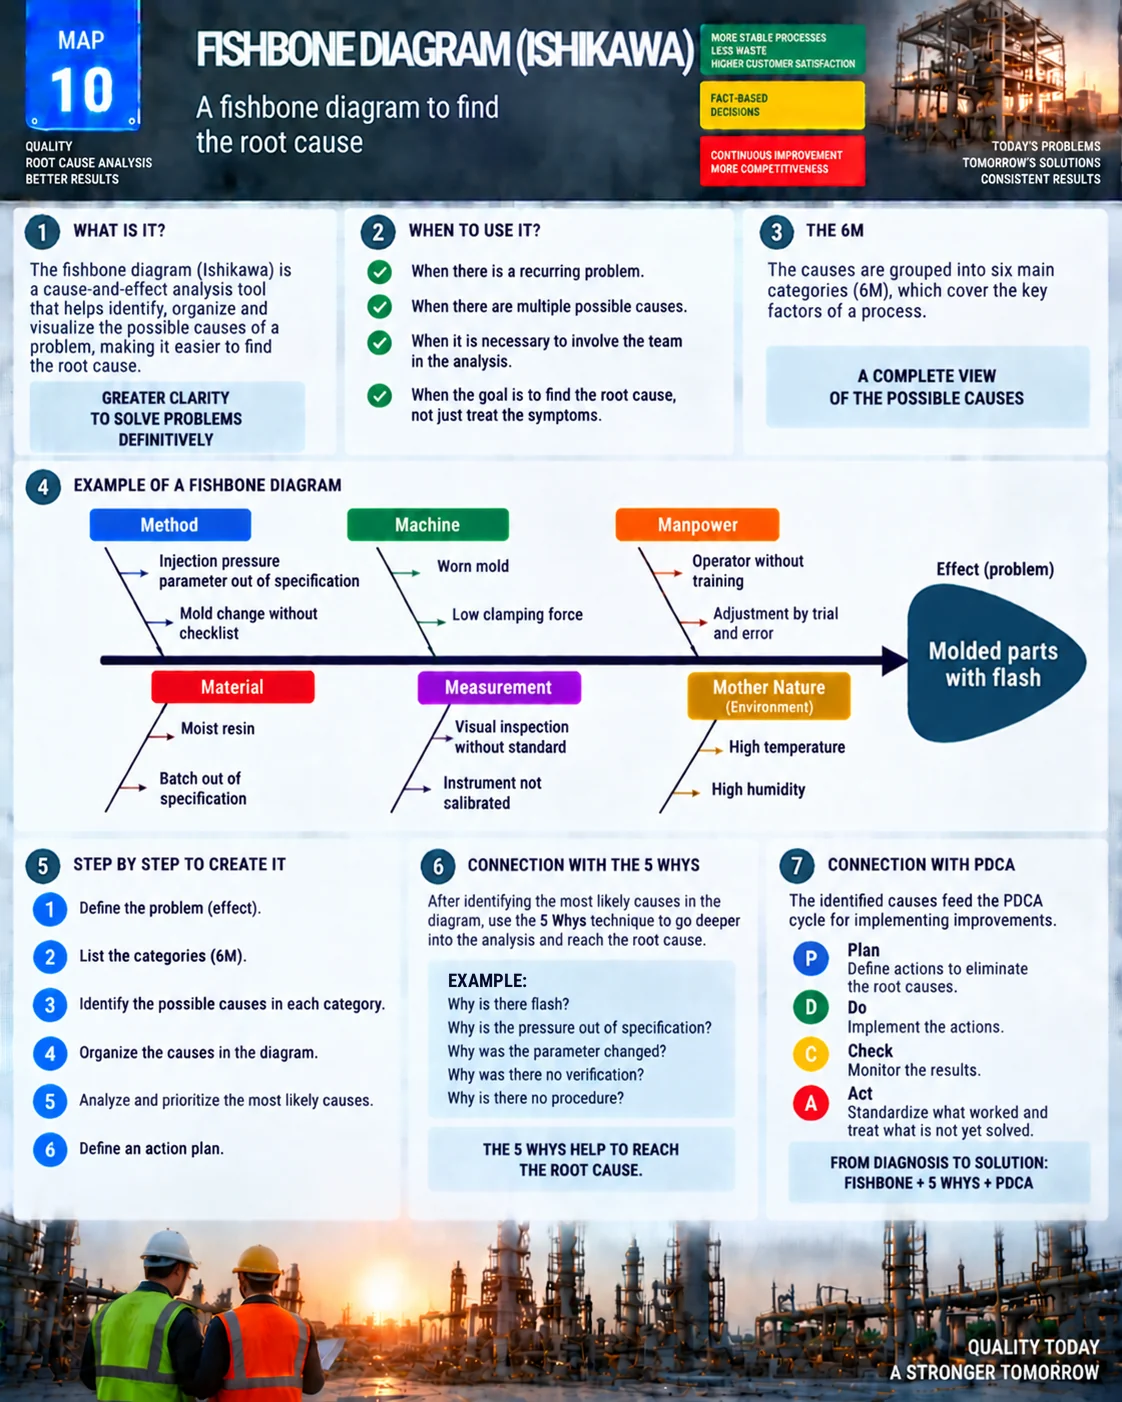
Fishbone diagram visual map
The map sums up when to use it, the six categories, a complete example of flash on molded parts and the link to the 5 Whys and PDCA.
When to use it
- When a problem keeps coming back and the cause is not obvious.
- When there are several possible causes and the team disagrees.
- When people from different areas need to be involved.
- When the goal is the root cause, not just treating the symptom.
The 6M categories
| Category | Typical questions |
|---|---|
| Method | Does a procedure exist, is it clear and is it followed? |
| Machine | Are the equipment, mold or tool in good condition? |
| Manpower | Are people trained? Are settings changed by trial and error? |
| Material | Does the raw material meet specification? |
| Measurement | Is the gauge calibrated? Is the inspection criterion clear? |
| Mother Nature (environment) | Do temperature, humidity, lighting or dust play a role? |
In services and offices the categories may change (policies, procedures, people, systems), but the logic stays the same.
Example: molded parts with flash
| Category | Causes found |
|---|---|
| Method | Injection pressure parameter out of specification; mold change without a checklist |
| Machine | Worn mold; low clamping force |
| Manpower | Operator without training; adjustment by trial and error |
| Material | Moist resin; batch out of specification |
| Measurement | Visual inspection without a standard; instrument not calibrated |
| Mother Nature | High temperature; high humidity |
Twelve possible causes instead of one hunch. The next step is to prioritize with data: check the parameter log, measure resin moisture and inspect the mold instead of arguing over who is right.
Step by step
- Define the problem (effect) in specific, measurable terms: "flash on 4% of parts from press 3".
- Draw the spine and list the categories (6M).
- Brainstorm causes in each category with the team, ideally at the gemba.
- Organize, separating causes from symptoms and grouping duplicates.
- Analyze and prioritize the most likely causes with data.
- Define an action plan for the confirmed causes.
Connection with the 5 Whys
The fishbone widens the view; the 5 Whys go deep on each likely cause. In the example:
- Why is there flash? Because injection pressure is above standard.
- Why is it above standard? Because the parameter was changed.
- Why was it changed? Because an operator adjusted it to compensate for short shots.
- Why was there no check? Because there is no parameter checklist at shift change.
- Why is there no checklist? Because the procedure was never standardized.
The root cause is the missing standard, and the fix is standardized work, not blaming the operator.
Connection with PDCA
In PDCA, the fishbone belongs to Plan: defining the problem and analyzing causes. Then come Do, Check whether flash went down, and Act to standardize what worked. An A3 report usually includes the diagram in its analysis section.
Common mistakes and checklist
- A vaguely defined problem.
- A list of people to blame instead of causes.
- Stopping at the drawing without verifying causes with data.
- Doing it alone, without the people who know the process.
- Picking the cause backed by the loudest voice in the room.
- Specific, measurable effect.
- Cross-functional team.
- Causes in all six categories.
- Likely causes verified with data.
- Action plan with owners and due dates.
Frequently asked questions
What is a fishbone diagram?
A visual tool shaped like a fish skeleton that organizes the possible causes of a problem into categories.
What are the 6Ms?
Method, machine, manpower, material, measurement and Mother Nature (environment).
How is a fishbone diagram different from the 5 Whys?
The fishbone surfaces many possible causes; the 5 Whys drill one cause down to its root. They work together.
Who created the Ishikawa diagram?
Kaoru Ishikawa, a Japanese engineer and pioneer of quality control in Japan.
How do you prioritize the causes?
Verify the most likely ones with process data; a Pareto chart helps show which ones carry the most weight.
Sources
- ISHIKAWA, K. Guide to Quality Control. Tokyo: Asian Productivity Organization.
- ISHIKAWA, K. What Is Total Quality Control? The Japanese Way. Englewood Cliffs: Prentice Hall.
- TAGUE, N. R. The Quality Toolbox. Milwaukee: ASQ Quality Press.
Want a ready-to-use fishbone?
Download the free "Problem Solving Kit" e-book, with PDCA, A3, 5 Whys and Ishikawa.
Download the e-book
About the author
Lean Manufacturing & Behavioral Management Specialist
Over 20 years in the automotive and metalworking industries (GM and Dana), Lean Manufacturing practitioner since 2006. SENAI instructor and mentor in Brazil’s Brasil Mais Produtivo program, delivering consulting, training and audits for 50+ companies, combining quality, productivity and people development.