
What the 7 basic quality tools are
The 7 basic quality tools are simple, visual methods to collect, organize and analyze data and to control processes. Kaoru Ishikawa gathered and promoted them in Japan, arguing that most shop-floor quality problems can be solved with them, without advanced statistics.
Together they cover the path from raw data to a process under control.
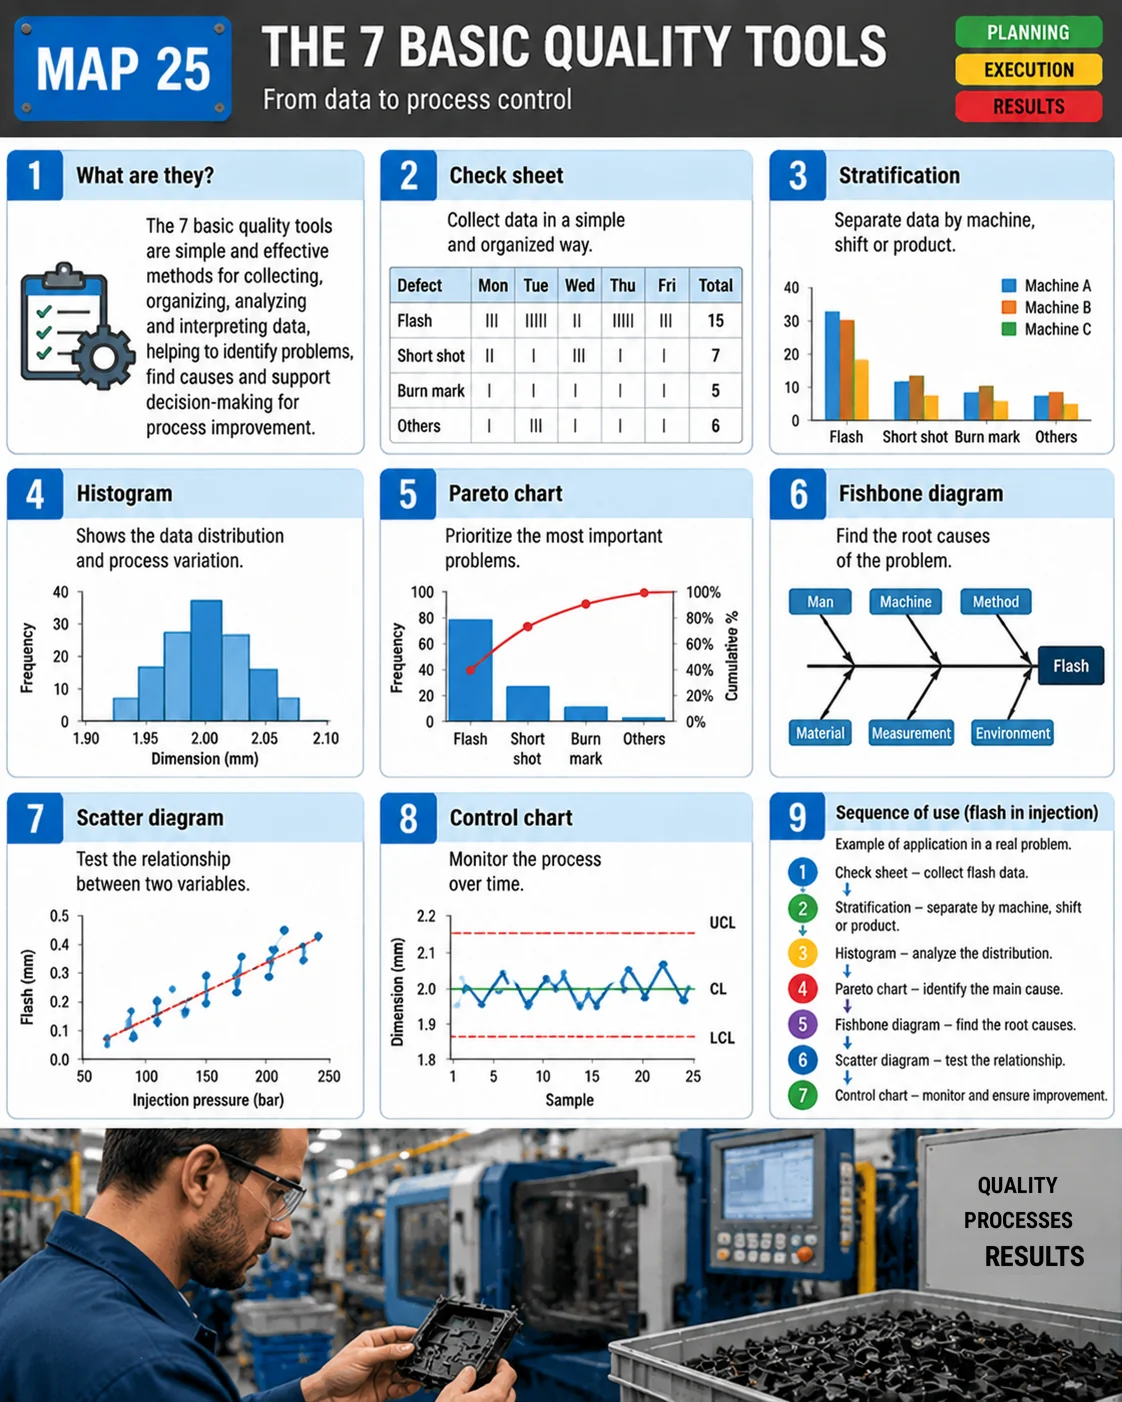
The 7 tools visual map
The map shows each tool with a mini chart and the sequence of use on a real flash problem in injection molding.
The tools, one by one
| Tool | What it is for | Question it answers |
|---|---|---|
| Check sheet | Collect data in a standard way | How often does each defect occur? |
| Stratification | Separate data by machine, shift, product or supplier | Where is the problem concentrated? |
| Histogram | Show the distribution of a measurement | How does the dimension vary? |
| Pareto chart | Rank causes by importance | What should we tackle first? |
| Fishbone diagram | Organize possible causes into categories | What are the likely causes? |
| Scatter diagram | Test the relationship between two variables | Does one thing affect the other? |
| Control chart | Monitor the process over time | Is the process stable? |
Sequence of use: flash in injection molding
- Check sheet: for one week the team logs defects by type and day; flash shows up 15 times, ahead of short shots, burn marks and others.
- Stratification: split by machine, flash is concentrated on machine A.
- Histogram: the part dimension shows how the process varies around the target.
- Pareto chart: flash is the most frequent defect and becomes the priority.
- Fishbone diagram: the team lists causes across the 6Ms and suspects injection pressure.
- Scatter diagram: plotting injection pressure against flash size shows a positive correlation.
- Control chart: after the adjustment, the dimension is monitored to make sure the improvement holds.
Going deeper on each tool
- Pareto chart, with cumulative percentage and the 80/20 rule.
- Fishbone diagram, with the 6Ms and the 5 Whys.
- SPC and control charts, with control limit calculations.
- Cp and Cpk, which build on histograms and control charts to measure capability.
A warning on scatter diagrams: correlation is not causation
A scatter diagram shows whether two variables move together, but it does not prove one causes the other. A third variable may drive both. Confirm the cause with a controlled test: change one factor, hold the rest steady and watch the effect.
Where they fit in PDCA and DMAIC
In PDCA, the check sheet, stratification, histogram, Pareto, fishbone and scatter diagram support Plan; the control chart supports Check and Act. In DMAIC, they show up mostly in Measure, Analyze and Control.
Common mistakes
- Collecting data without first defining the question.
- Using fuzzy categories on the check sheet.
- Skipping stratification and mixing machines and shifts.
- Treating correlation as causation.
- Making charts and not acting on them.
Frequently asked questions
What are the 7 basic quality tools?
Check sheet, stratification, histogram, Pareto chart, fishbone diagram, scatter diagram and control chart.
Who created the 7 quality tools?
Kaoru Ishikawa gathered and promoted them in Japan, building on techniques that already existed.
In what order should the tools be used?
A common sequence is collect, stratify, see the distribution, prioritize, find causes, test relationships and control.
What is the difference between a histogram and a Pareto chart?
A histogram shows the distribution of a measurement; a Pareto chart ranks categories, such as defect types, by frequency or cost.
Do some lists replace stratification with a flowchart?
Yes. Some versions list the flowchart instead of stratification; both are in use.
Sources
- ISHIKAWA, K. Guide to Quality Control. Tokyo: Asian Productivity Organization.
- TAGUE, N. R. The Quality Toolbox. Milwaukee: ASQ Quality Press.
- MONTGOMERY, D. C. Introduction to Statistical Quality Control. Hoboken: Wiley.
Want the tools ready to use?
Download the free "Problem Solving Kit" e-book, with PDCA, A3, 5 Whys and Ishikawa.
Download the e-book
About the author
Lean Manufacturing & Behavioral Management Specialist
Over 20 years in the automotive and metalworking industries (GM and Dana), Lean Manufacturing practitioner since 2006. SENAI instructor and mentor in Brazil’s Brasil Mais Produtivo program, delivering consulting, training and audits for 50+ companies, combining quality, productivity and people development.