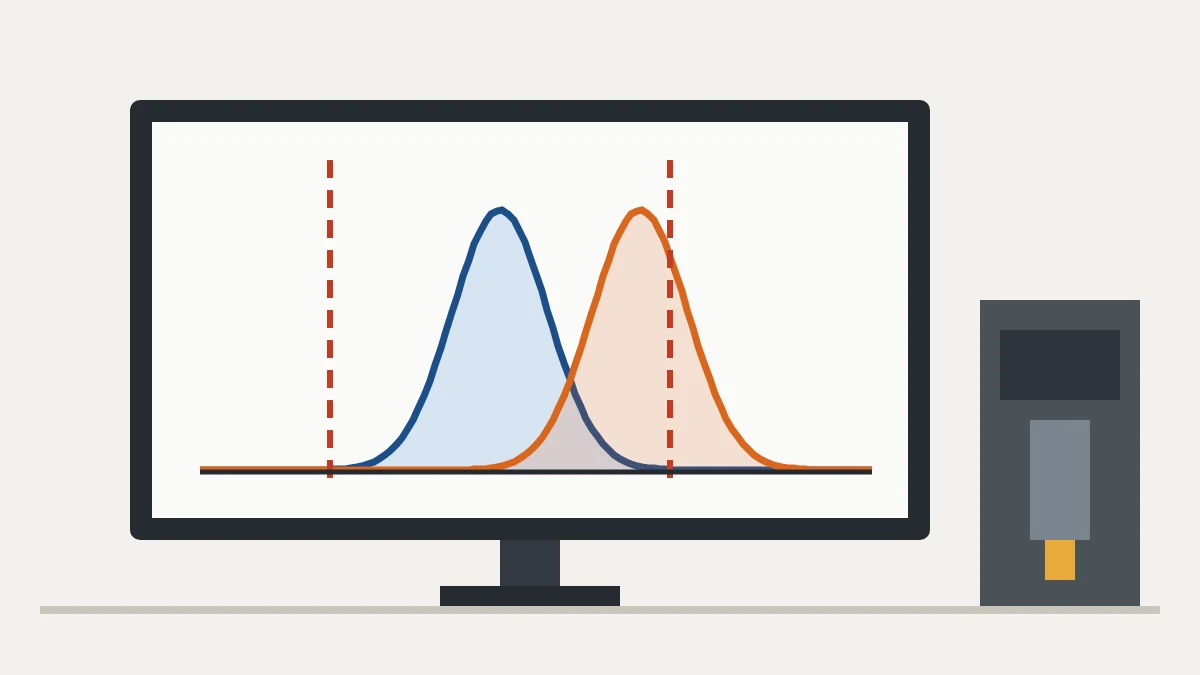
What Cp and Cpk are
Cp and Cpk are capability indices: they compare the natural variation of a process with the customer's tolerance. They answer a simple question: with today's variation, can the process produce within specification?
Cp only looks at width: does the variation fit inside the tolerance? Cpk also looks at location: is the mean centered, or is it crowding one of the limits?
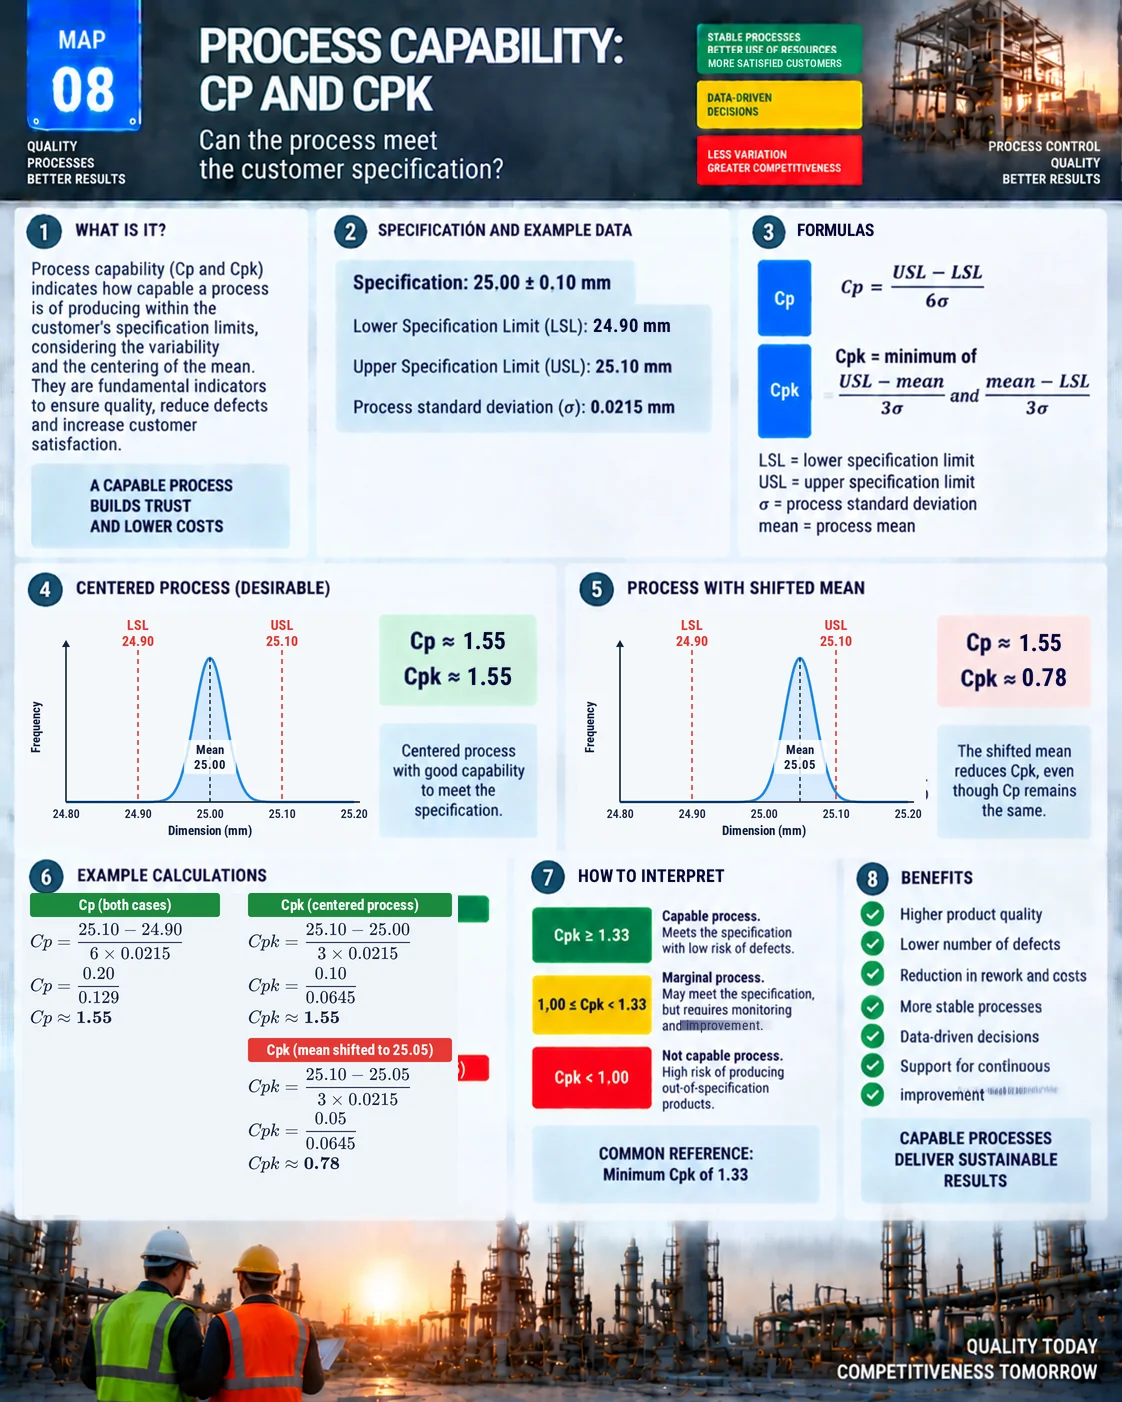
Cp and Cpk visual map
The map brings together the example specification, the formulas, charts of the centered and shifted process, the calculations and the interpretation rule.
Formulas
Cp = (USL − LSL) ÷ 6σ
Cpk = min[(USL − mean) ÷ 3σ, (mean − LSL) ÷ 3σ]
USL and LSL are the upper and lower specification limits; σ is the process standard deviation. With a stable control chart, σ can be estimated as R̄ ÷ d2, as shown in the article on SPC and control charts.
Worked example: a 25.00 ± 0.10 mm shaft
The specification is 25.00 ± 0.10 mm (LSL 24.90, USL 25.10) and the process standard deviation is 0.0215 mm.
| Case | Mean | Cp | Cpk |
|---|---|---|---|
| Centered process | 25.00 | 0.20 ÷ 0.129 ≈ 1.55 | 0.10 ÷ 0.0645 ≈ 1.55 |
| Shifted mean | 25.05 | ≈ 1.55 | 0.05 ÷ 0.0645 ≈ 0.78 |
Cp does not change because the variation is the same. Cpk drops by half because the mean has moved toward the upper limit. In practice the shifted process makes about 1% of parts above 25.10 mm, while the centered one stays at a few parts per million.
How to interpret it
| Cpk | Reading |
|---|---|
| ≥ 1.33 | Capable process with low risk of defects |
| 1.00 to 1.33 | Marginal process: it meets spec but needs monitoring and improvement |
| < 1.00 | Not capable: high risk of out-of-spec parts |
A minimum of 1.33 is a common contractual reference, especially in automotive, which often asks for higher values in initial studies and for critical characteristics. The customer requirement always rules. When Cp is high and Cpk is low, the issue is centering and an adjustment fixes it; when both are low, the issue is variation, which calls for process improvement such as a Six Sigma project.
Stability before capability
Cp and Cpk only make sense for a stable process with no special causes. If the control chart shows out-of-control points, σ does not represent the process and the index misleads. The right order is to stabilize with SPC first and then measure capability. The NIST e-Handbook covers the definitions and conditions of use.
Cp and Cpk or Pp and Ppk?
Cp and Cpk use the short-term, within-subgroup standard deviation. Pp and Ppk use the overall, long-term standard deviation of all the data. If Ppk is well below Cpk, the process shifts over time, between shifts, batches or setups, and those sources are worth investigating.
How to apply it
- Define the specification limits of the critical characteristic.
- Validate the measurement system.
- Collect enough data from a stable process, for example 25 subgroups of 5 parts.
- Calculate the mean, standard deviation, Cp and Cpk.
- Act: center the process if Cpk < Cp; reduce variation if both are low; monitor with SPC.
Common mistakes
- Calculating capability from too little data.
- Ignoring centering and looking only at Cp.
- Confusing Cp with Cpk.
- Calculating with an unstable process.
- Taking action without analyzing the cause of variation.
Frequently asked questions
What is the difference between Cp and Cpk?
Cp compares the width of the tolerance with the variation; Cpk also accounts for where the mean sits relative to the limits.
How do you calculate Cpk?
Compute (USL − mean) ÷ 3σ and (mean − LSL) ÷ 3σ and take the smaller value.
What is a good Cpk?
A Cpk of at least 1.33 is the most common reference; below 1.00 the process is not capable.
Why did Cpk drop while Cp stayed the same?
Because the mean shifted; variation is unchanged, but the process moved closer to one limit.
Can I calculate Cpk on an unstable process?
You shouldn't. Stabilize the process with SPC first; only then does the index reflect reality.
Sources
- NIST/SEMATECH e-Handbook of Statistical Methods. What is Process Capability? https://www.itl.nist.gov/div898/handbook/pmc/section1/pmc16.htm
- MONTGOMERY, D. C. Introduction to Statistical Quality Control. Hoboken: Wiley.
- AIAG. Statistical Process Control (SPC) Reference Manual. Southfield: AIAG.
Too much variation? Go after the cause.
Download the free "Problem Solving Kit" e-book, with PDCA, A3, 5 Whys and Ishikawa.
Download the e-book
About the author
Lean Manufacturing & Behavioral Management Specialist
Over 20 years in the automotive and metalworking industries (GM and Dana), Lean Manufacturing practitioner since 2006. SENAI instructor and mentor in Brazil’s Brasil Mais Produtivo program, delivering consulting, training and audits for 50+ companies, combining quality, productivity and people development.