Measure little, but measure what changes the decision
In lean production, an indicator exists to provoke action. If nobody changes what they do when they see the number, it is decoration. The right question before adding an indicator is: what decision does it support, and who makes it?
This article does not repeat formulas. Each indicator has its own text with the calculation, and here you will find the link. The focus is on building the dashboard: which six indicators form the core, what to measure at each level, and how to avoid common pitfalls.
The essential dashboard: six indicators
| Indicator | Question it answers | Where to learn the calculation |
|---|---|---|
| OEE | How much of the planned time becomes good parts, at the ideal rate? | OEE |
| FPY | How many parts come out good on the first pass, without rework? | FPY and RTY |
| Lead time | How long does the product take from entry to delivery? | Lead time |
| Takt time | What pace does the customer require? | Takt time |
| WIP | How much material is in process, stopped, or waiting? | VSM |
| On-time delivery | Does the customer receive it when agreed? | Explained below |
The six cover the four dimensions that matter: equipment (OEE), quality (FPY), flow (lead time and WIP), and customer (takt and on-time delivery). If one of them gets worse and you cannot explain why, look at the others: they are linked to each other.
How the indicators connect
Takt is the reference: it defines the cadence the factory must follow to meet demand. OEE shows how much of the equipment's time actually produces according to that cadence. FPY reveals how much of that effort is lost to rework and scrap.
WIP and lead time go together: more material in process means more waiting, and more waiting means more time until the customer is served. Reducing WIP is generally the shortest path to reducing lead time. This is consistent with the thinking behind continuous flow and pull production.
On-time delivery is the final result the customer sees. It is the proportion of orders delivered within the agreed date. In an illustrative example, if 47 of 50 orders in the month arrived on time, on-time delivery was 94%. The calculation is simple. What changes the result is the flow behind it.
What to measure at each level
The same indicator does not serve everyone. Frequency and detail change depending on who acts.
Level 1: company or plant
Who decides: directors and managers. Frequency: monthly or weekly. Indicators: on-time delivery, total lead time, consolidated FPY, and cost of quality. The goal is to know whether the system delivers to the customer and whether the direction is right. Hoshin Kanri connects this level to the others.
Level 2: line or cell
Who decides: supervisor and engineering. Frequency: daily. Indicators: OEE per critical piece of equipment, WIP between stations, FPY per step, and schedule adherence. The goal is to find the bottleneck and the day's losses. The theory of constraints helps decide where to act first.
Level 3: workstation and shift
Who decides: operator and team leader. Frequency: hour by hour. Indicators: parts produced against the hourly target, stops with a reason, and defects at the workstation. The goal is to react within the same shift, without waiting for a report. This is where the board and the andon come in.
Deployment: from the plant number to the workstation
A good dashboard is a tree. The indicator at the top is explained by the ones below. If the plant's on-time delivery drops, level 2 answers with the bottleneck's OEE and the WIP before it. Level 3 answers with the hour's stops and the workstation's deviations.
- Each higher-level indicator should have, at the lower level, at least one indicator that explains it.
- All levels use the same calculation definition. Divergence in method destroys trust.
- Each indicator has an owner, a target, and a defined action for when it falls off target.
Common measurement pitfalls
- Optimizing the local and losing the global. Raising the OEE of a machine that is not the bottleneck only produces inventory. Measure OEE where it limits the flow.
- Efficiency above all. Pursuing high utilization across the whole factory inflates WIP. In pull production, equipment standing idle for lack of orders can be the right decision.
- Indicator without action. If the deviation does not generate a plan, such as a 5W2H, the number is just decoration.
- Measuring what is easy. The data that is hard to collect is often the most useful, and measurement error needs to be tested.
- Contradictory targets. Demanding volume and quality without balance leads to shortcuts.
How to display the dashboard
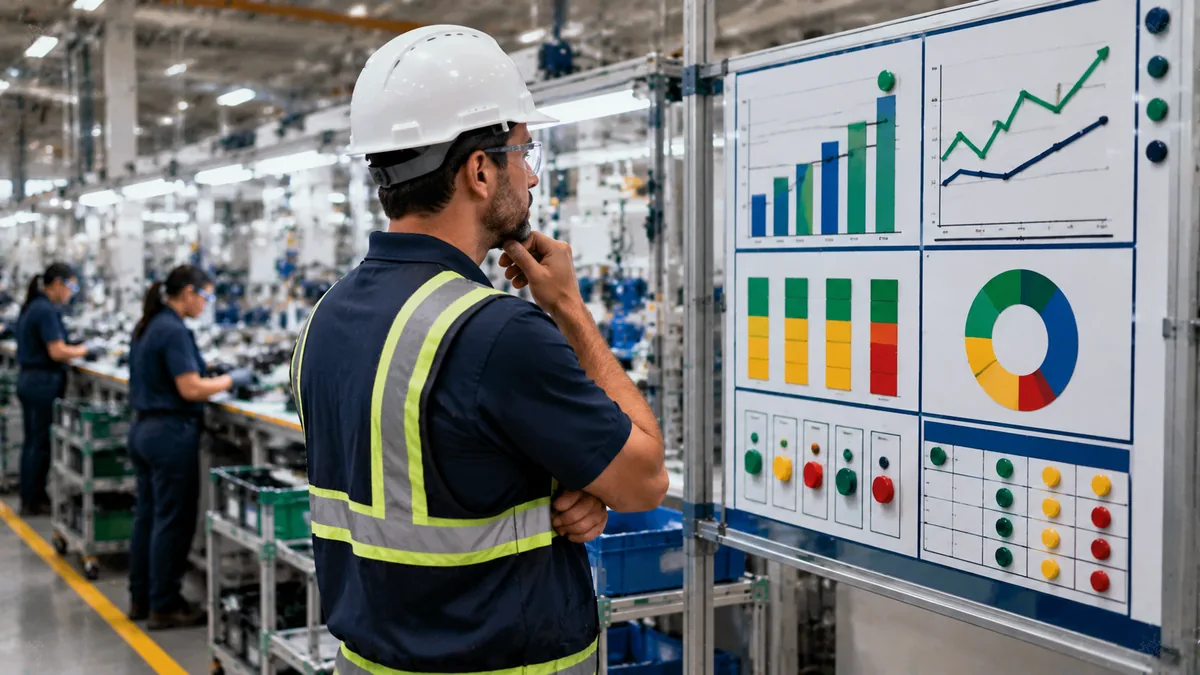
A dashboard only works if it is seen. On the shop floor, prefer simple boards next to the workstation, with colors for on and off target, updated by hand or digitally by the people doing the work. For practical ideas, see visual management with boards and indicators and 10 ideas to improve visual management.
Quality carries weight in this dashboard for practical reasons. A defect generates rework, which consumes capacity and lengthens lead time. The connection is covered in how quality affects efficiency.
Next step
Choose one line and build a minimal one-page dashboard with five numbers: takt, bottleneck OEE, FPY, WIP between the two main workstations, and on-time delivery for the most recent orders. Fill it in for two weeks, always by the same people, with the same definition. At the end, gather the team and ask which deviation repeated the most.
That deviation is the first improvement project. Solve the cause, update the standard, and only then add another indicator.
Frequently asked questions
What are the main indicators of lean production?
The most commonly used are OEE, FPY, lead time, takt time, WIP, and on-time delivery. Together, they cover equipment, quality, flow, and customer.
How many indicators should I track per level?
Few: three to five per level is usually enough. Each one needs an owner, a target, and a defined action for deviations.
What is WIP and why measure it?
WIP is work in process, the material between the entry and the exit of the line. The higher it is, the more waiting and the more lead time. Measuring it shows where the flow gets stuck.
Does high OEE mean a lean factory?
Not necessarily. High OEE on a machine that is not the bottleneck creates inventory. Interpret OEE together with WIP, lead time, and on-time delivery.
Keep studying
Sources
- LIKER, J. O Modelo Toyota. Porto Alegre: Bookman.
- ROTHER, M.; SHOOK, J. Aprendendo a Enxergar. São Paulo: Lean Institute Brasil.
- Lean Enterprise Institute. Takt Time. https://www.lean.org/lexicon-terms/takt-time/
- Lean Enterprise Institute. Cycle Time. https://www.lean.org/lexicon-terms/cycle-time/
Want to measure what really matters?
Download the free e-book on performance indicators and track the losses in your operation.
Download the e-book
About the author
Lean Manufacturing & Behavioral Management Specialist
Over 20 years in the automotive and metalworking industries (GM and Dana), Lean Manufacturing practitioner since 2006. SENAI instructor and mentor in Brazil’s Brasil Mais Produtivo program, delivering consulting, training and audits for 50+ companies, combining quality, productivity and people development.