
What queuing theory is
Queuing theory studies how arrivals and service create waiting. It helps size tool cribs, maintenance teams, loading docks and any resource that serves requests arriving at random.
Queuing theory visual map
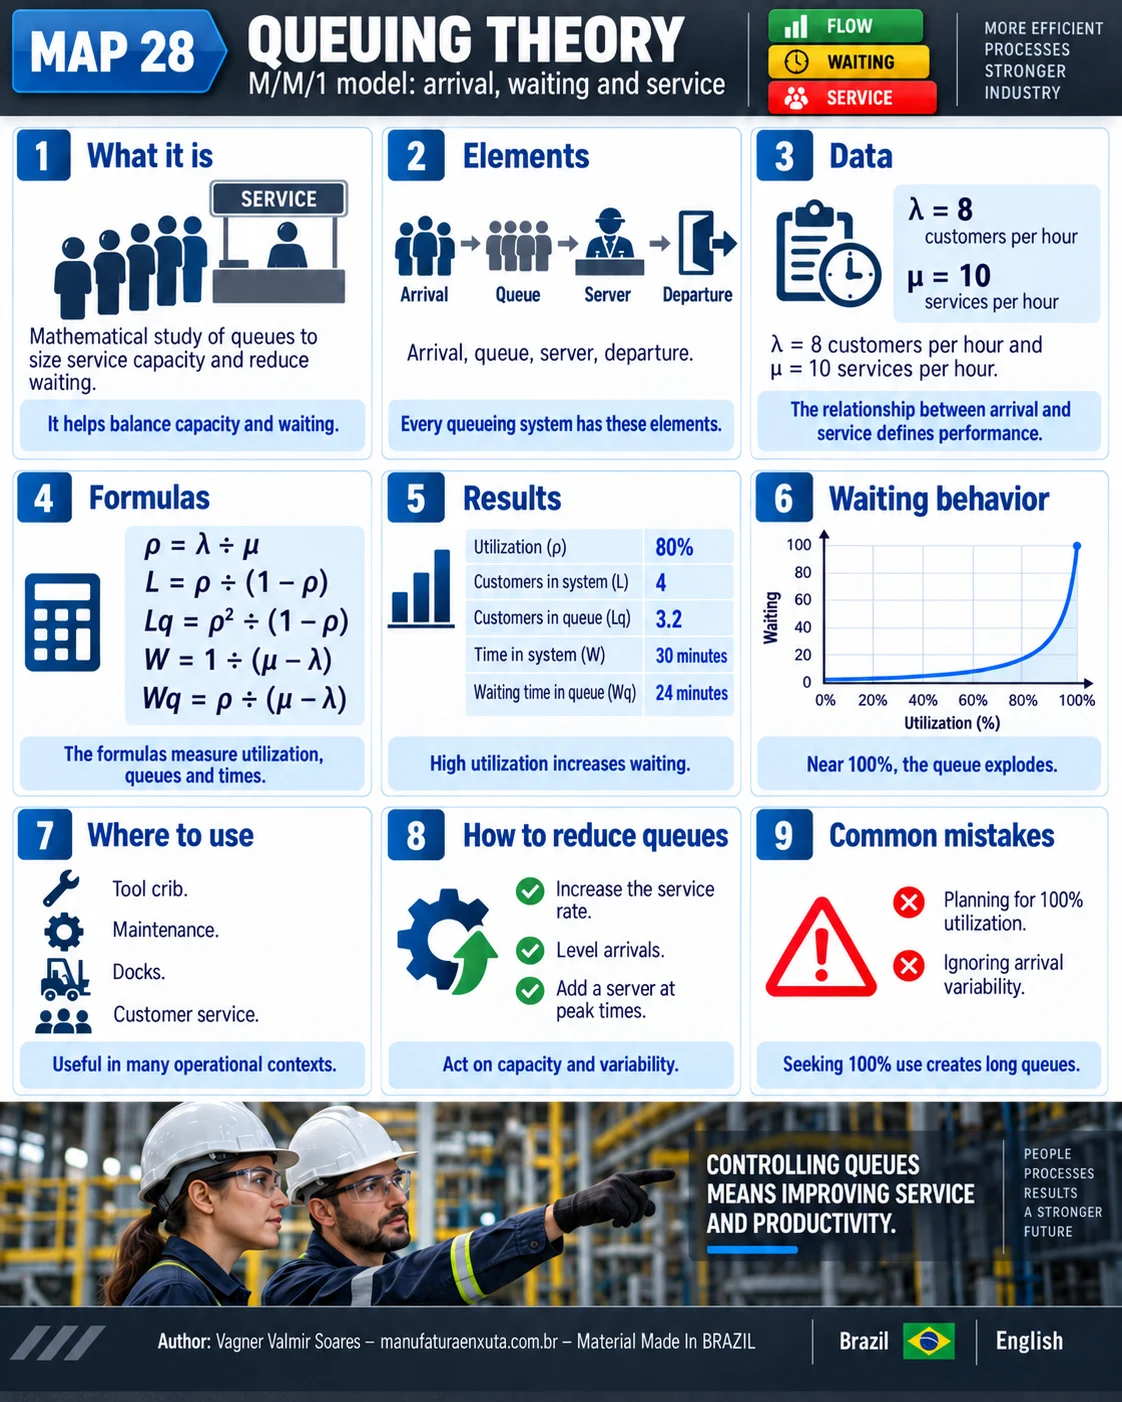
The map shows the M/M/1 model, the formulas, the results and the waiting time chart.
The M/M/1 model
M/M/1 means random (Poisson) arrivals, random (exponential) service times and one server.
| Measure | Formula |
|---|---|
| Utilization (ρ) | λ ÷ μ |
| Number in system (L) | ρ ÷ (1 − ρ) |
| Number in queue (Lq) | ρ² ÷ (1 − ρ) |
| Time in system (W) | 1 ÷ (μ − λ) |
| Waiting time (Wq) | ρ ÷ (μ − λ) |
Example: 8 arrivals and 10 services per hour
| Result | Value |
|---|---|
| Utilization | 8 ÷ 10 = 80% |
| Number in system | 4 |
| Number in queue | 3.2 |
| Time in system | 1 ÷ (10 − 8) = 0.5 h = 30 min |
| Waiting time | 0.8 ÷ 2 = 0.4 h = 24 min |
The numbers satisfy Little's Law: L = λ × W = 8 × 0.5 = 4 customers.
Why never plan for 100% utilization
Waiting explodes near 100%. With 10 services per hour: 8 arrivals give a 24-minute queue wait; 9 arrivals (90%) give 54 minutes; 9.5 arrivals (95%) give about 1 h 54 min. A little spare capacity buys a lot of responsiveness, the same logic behind the bottleneck and overburden (muri).
How to reduce queues
- Increase service capacity or add a server at peak times.
- Reduce arrival variability with scheduling or leveling.
- Reduce service variability with standardized work.
- Eliminate rework, which comes back into the queue.
Common mistakes
- Planning for 100% utilization.
- Ignoring arrival variability.
- Using M/M/1 when there are several servers (use M/M/c).
- Sizing capacity without real data.
Frequently asked questions
What is the M/M/1 model?
A queue with random arrivals, random service times and a single server.
How is utilization calculated?
Divide the arrival rate by the service rate: ρ = λ ÷ μ.
What is the waiting time in the example?
24 minutes in the queue and 30 minutes in the system.
What is Little's Law?
L = λ × W: the average number in the system equals the arrival rate times the time in the system.
Why not run at 100% utilization?
Because waiting time grows without limit as utilization approaches 100%.
Sources
- LITTLE, J. D. C. A proof for the queuing formula L = λW. Operations Research, v. 9, 1961.
- HILLIER, F. S.; LIEBERMAN, G. J. Introduction to Operations Research. New York: McGraw-Hill.
- HOPP, W. J.; SPEARMAN, M. L. Factory Physics. Long Grove: Waveland Press.
Want the tools ready to use?
Download the free "Problem Solving Kit" e-book, with PDCA, A3, 5 Whys and Ishikawa.
Download the e-book
About the author
Lean Manufacturing & Behavioral Management Specialist
Over 20 years in the automotive and metalworking industries (GM and Dana), Lean Manufacturing practitioner since 2006. SENAI instructor and mentor in Brazil’s Brasil Mais Produtivo program, delivering consulting, training and audits for 50+ companies, combining quality, productivity and people development.