
What production capacity is
Production capacity is the maximum output a process can deliver in a given period with the resources available. Knowing your real capacity is what separates a reliable delivery promise from a delay waiting to happen.
Production capacity visual map
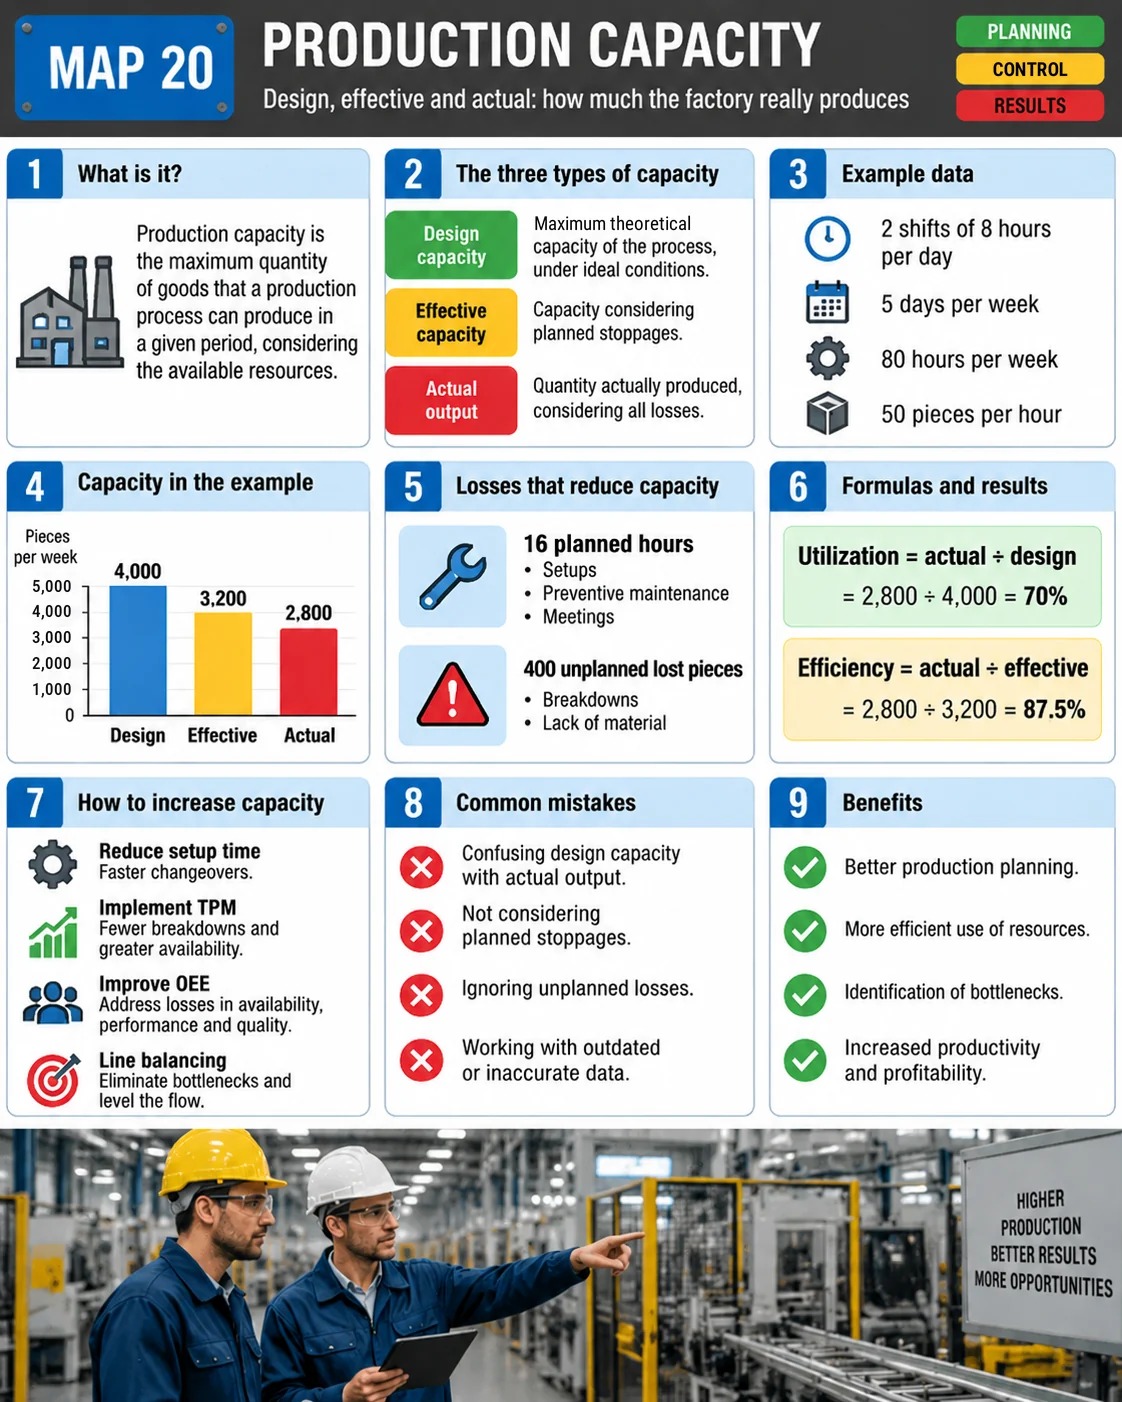
The map shows the three types of capacity, the weekly example, the losses and the utilization and efficiency formulas.
The three levels of capacity
| Level | What it accounts for |
|---|---|
| Design capacity | The theoretical maximum under ideal conditions |
| Effective capacity | Capacity after planned stoppages (changeovers, preventive maintenance, meetings) |
| Actual output | What really came out after unplanned losses (breakdowns, missing material) |
Example: a two-shift line
The line runs 2 shifts of 8 hours, 5 days a week: 80 hours. The rate is 50 pieces per hour.
| Level | Calculation | Pieces per week |
|---|---|---|
| Design | 80 h × 50 | 4,000 |
| Effective | (80 − 16 planned hours) × 50 | 3,200 |
| Actual | 3,200 − 400 pieces of unplanned losses | 2,800 |
Utilization and efficiency
Utilization = actual output ÷ design capacity = 2,800 ÷ 4,000 = 70%
Efficiency = actual output ÷ effective capacity = 2,800 ÷ 3,200 = 87.5%
Utilization shows how much of the potential is used; efficiency shows how much of the capacity left after planned stops turned into output. In the example the line loses 30% of its potential: 20 points to planned stoppages and 10 to unplanned losses.
Capacity, OEE and the bottleneck
OEE breaks down a machine's availability, performance and quality losses and helps explain the gap between effective capacity and actual output. Plant capacity is set by the bottleneck: adding capacity to non-bottleneck resources does not raise output.
How to increase capacity
- Cut changeover time with SMED.
- Implement TPM to reduce breakdowns and gain availability.
- Improve OEE by attacking availability, performance and quality losses.
- Balance the line and remove bottlenecks.
- Only then consider overtime, extra shifts or new machines.
Common mistakes
- Confusing design capacity with actual output when promising dates.
- Ignoring planned stoppages.
- Ignoring unplanned losses.
- Working with outdated or inaccurate data.
Frequently asked questions
What is production capacity?
The maximum output a process can deliver in a period with the resources available.
What is the difference between design and effective capacity?
Design capacity is the theoretical maximum; effective capacity deducts planned stoppages such as changeovers and preventive maintenance.
How do you calculate capacity utilization?
Divide actual output by design capacity. In the example, 2,800 ÷ 4,000 = 70%.
How do you calculate efficiency?
Divide actual output by effective capacity. In the example, 2,800 ÷ 3,200 = 87.5%.
How can capacity grow without new machines?
By cutting changeovers, breakdowns and quality losses, and balancing the line to relieve the bottleneck.
Sources
- STEVENSON, W. J. Operations Management. New York: McGraw-Hill.
- HEIZER, J.; RENDER, B.; MUNSON, C. Operations Management. Hoboken: Pearson.
- GOLDRATT, E. M.; COX, J. The Goal. Great Barrington: North River Press.
Want to see where your capacity goes?
Download the free metrics e-book and measure the losses on your line.
Download the e-book
About the author
Lean Manufacturing & Behavioral Management Specialist
Over 20 years in the automotive and metalworking industries (GM and Dana), Lean Manufacturing practitioner since 2006. SENAI instructor and mentor in Brazil’s Brasil Mais Produtivo program, delivering consulting, training and audits for 50+ companies, combining quality, productivity and people development.