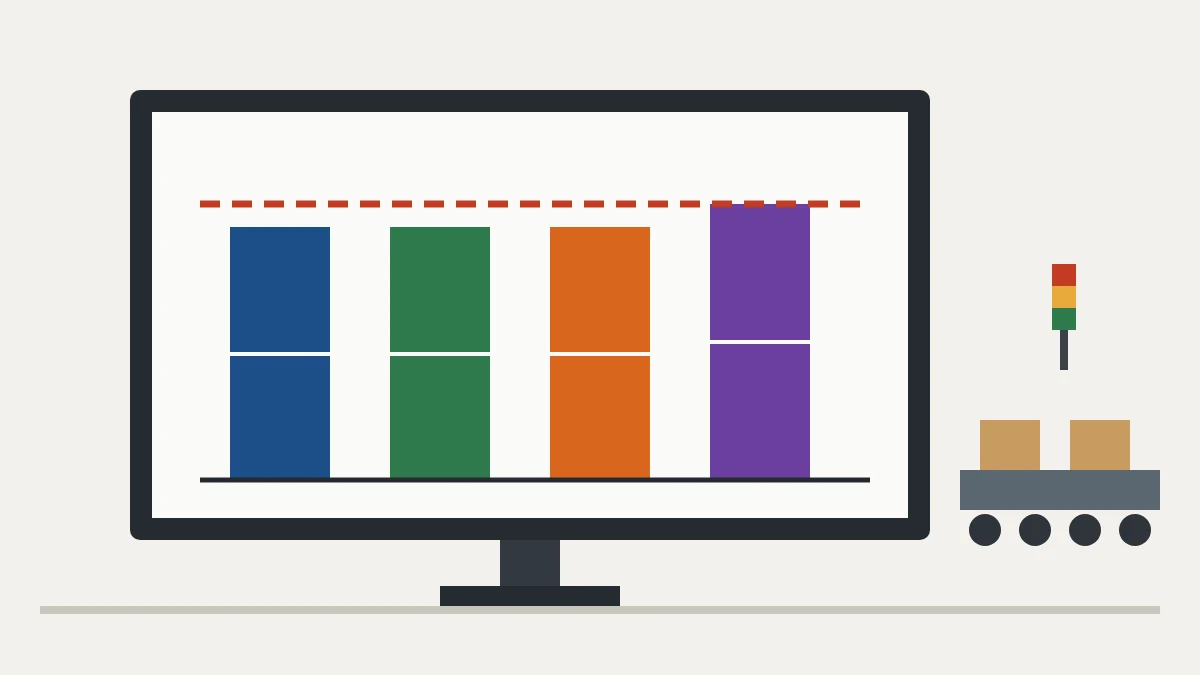
What line balancing is
Line balancing means distributing tasks among workstations so each station carries a load close to takt time. The result is continuous flow, without one overloaded station building a queue while another waits for work.
An unbalanced line runs at the pace of its slowest station, piles up work in process and wastes the capacity of the others. Balancing brings each station's capacity in line with customer demand.
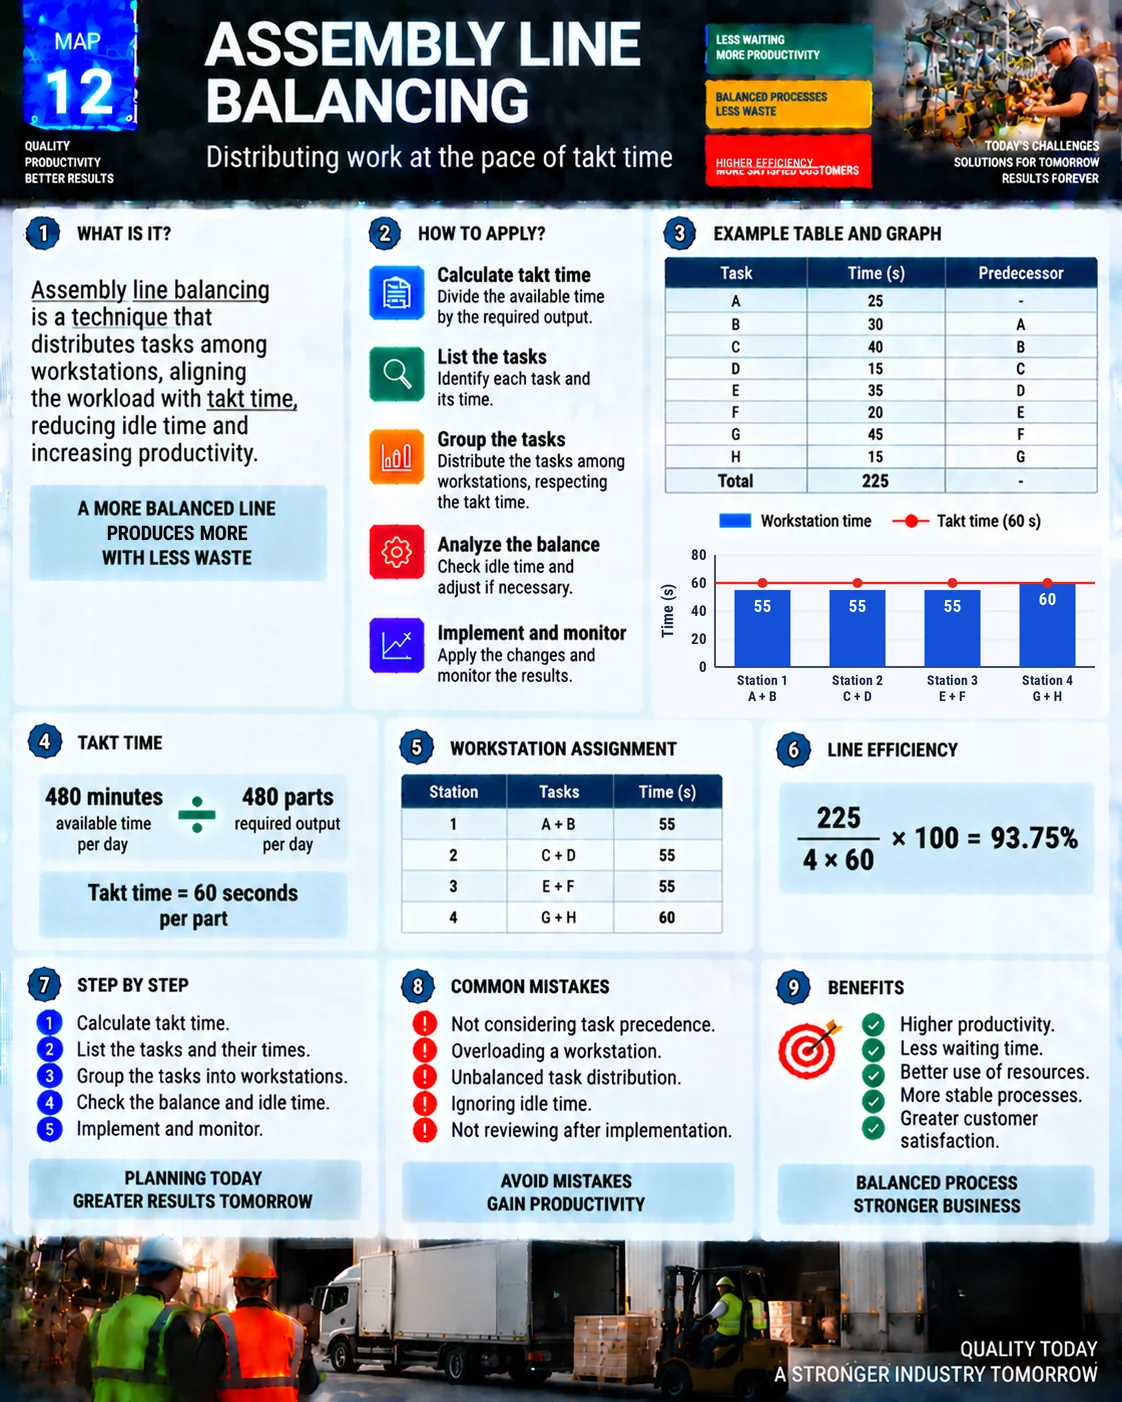
Line balancing visual map
The map shows the takt time calculation, the task times, the assignment to four stations, the balance chart and the efficiency.
Step 1: calculate takt time
Takt time = available time ÷ demand
With 480 minutes available per day and demand of 480 parts, takt time is 1 minute, or 60 seconds per part. No station may carry more than 60 seconds of work.
Step 2: list the tasks and their times
| Task | Time (s) | Predecessor |
|---|---|---|
| A | 25 | - |
| B | 30 | A |
| C | 40 | B |
| D | 15 | C |
| E | 35 | D |
| F | 20 | E |
| G | 45 | F |
| H | 15 | G |
| Total | 225 |
Times come from real time studies using the standard method. The predecessor column shows what must be done first; here the tasks run in sequence.
Step 3: minimum number of stations and assignment
Minimum stations = total task time ÷ takt = 225 ÷ 60 = 3.75, rounded up to 4
| Station | Tasks | Load (s) | Idle (s) |
|---|---|---|---|
| 1 | A + B | 55 | 5 |
| 2 | C + D | 55 | 5 |
| 3 | E + F | 55 | 5 |
| 4 | G + H | 60 | 0 |
Every station is at or below takt and the sequence is respected. The rule of thumb is to fill each station with the next allowed tasks without exceeding takt.
Step 4: line efficiency
Efficiency = total task time ÷ (stations × takt) × 100 = 225 ÷ (4 × 60) × 100 = 93.75%
Total idle time is 15 seconds per cycle (6.25% balance delay). The closer to 100%, the better, although a little slack helps absorb variation.
The balance chart (yamazumi)
The balance chart stacks each station's tasks in a bar and draws the takt line. It immediately shows the bottleneck, the stations with slack and which tasks to move. Lean lines use it together with standardized work and review it whenever demand changes.
How to improve the balance
- Split long tasks, such as G (45 s), to redistribute the load.
- Remove waste inside the tasks before redistributing.
- Rebalance when takt changes with demand; heijunka helps stabilize the mix.
- Attack the bottleneck station, as the Theory of Constraints teaches.
Common mistakes and checklist
- Ignoring task precedence.
- Loading a station above takt.
- Distributing work unevenly.
- Ignoring idle time and variation in task times.
- Not reviewing the balance after implementation.
- Takt calculated from real demand and available time.
- Task times measured with the standard method.
- Precedence mapped.
- No station above takt.
- Efficiency and idle time calculated.
- Balance chart posted on the line.
Frequently asked questions
What is line balancing?
Distributing tasks among workstations so each one carries a load close to takt time, creating continuous flow.
How do you calculate the minimum number of workstations?
Divide the total task time by takt time and round up: 225 ÷ 60 = 3.75, so 4 stations.
How do you calculate line efficiency?
Divide the total task time by the number of stations times takt: 225 ÷ (4 × 60) = 93.75%.
What is a yamazumi chart?
A stacked bar chart showing each station's workload against the takt line, used to see and adjust the balance.
Why doesn't efficiency reach 100%?
Because tasks rarely split perfectly among stations, so some time is left idle.
Sources
- SLACK, N.; BRANDON-JONES, A.; JOHNSTON, R. Operations Management. Harlow: Pearson.
- ROTHER, M.; HARRIS, R. Creating Continuous Flow. Cambridge, MA: Lean Enterprise Institute.
- Lean Enterprise Institute. Cycle Time. https://www.lean.org/lexicon-terms/cycle-time/
Want a line that flows at the customer's pace?
Download the free pull production e-book, with kanban, supermarkets and leveling.
Download the e-book
About the author
Lean Manufacturing & Behavioral Management Specialist
Over 20 years in the automotive and metalworking industries (GM and Dana), Lean Manufacturing practitioner since 2006. SENAI instructor and mentor in Brazil’s Brasil Mais Produtivo program, delivering consulting, training and audits for 50+ companies, combining quality, productivity and people development.