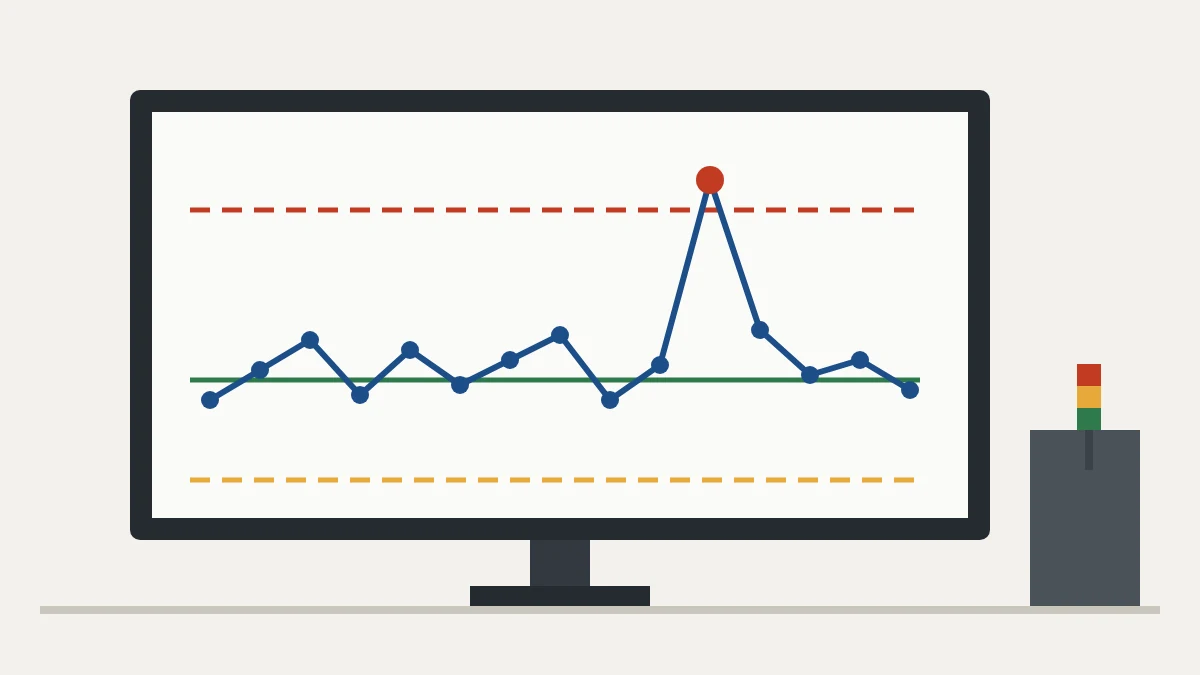
What a p-chart is
A p-chart is an attribute control chart that tracks the proportion of defective parts in samples over time, to show whether the process is stable or a special cause has appeared.
Attributes are counted (good or defective); variables are measured (diameter, weight). For variables, use the X-bar and R charts of SPC.
P-chart visual map
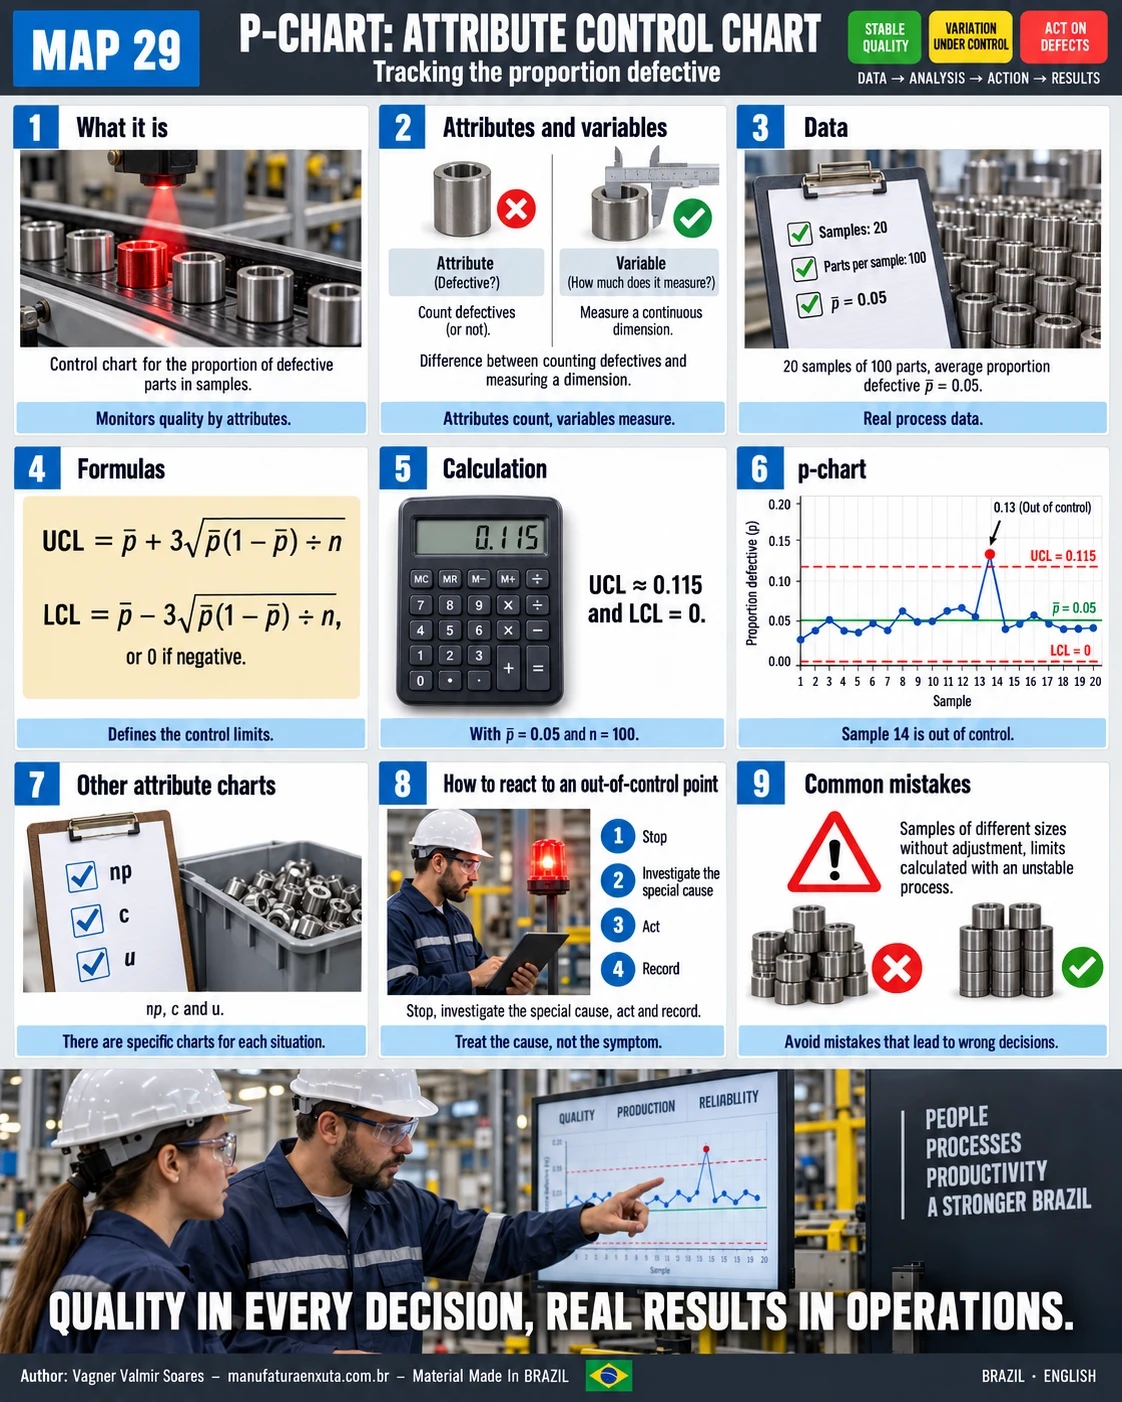
The map shows the formulas, the calculation and a chart with one point out of control.
Formulas
UCL = p̄ + 3 √(p̄(1 − p̄) ÷ n)
LCL = p̄ − 3 √(p̄(1 − p̄) ÷ n), or 0 if negative
Example: 20 samples of 100 parts
With p̄ = 0.05 and n = 100: √(0.05 × 0.95 ÷ 100) ≈ 0.0218.
| Limit | Calculation | Result |
|---|---|---|
| UCL | 0.05 + 3 × 0.0218 | ≈ 0.115 |
| Center line | p̄ | 0.05 |
| LCL | 0.05 − 0.0654 = −0.0154 | 0 (a proportion cannot be negative) |
Sample 14 has 13 defectives out of 100 (0.13), above the UCL: a special-cause signal.
How to react to an out-of-control point
- Confirm the data.
- Segregate the suspect batch.
- Investigate the special cause with the 5 Whys and a fishbone diagram.
- Correct the process.
- Record the action and monitor again.
Other attribute charts
| Chart | Tracks | When to use |
|---|---|---|
| p | Proportion defective | Fixed or variable sample size |
| np | Number of defectives | Constant sample size |
| c | Defects per inspection unit | Same area or unit inspected |
| u | Defects per unit | Variable sample size |
Common mistakes
- Mixing attributes with variables.
- Using different sample sizes without recalculating limits.
- Calculating limits from an unstable process.
- Reacting to every fluctuation, or ignoring an out-of-control point.
Frequently asked questions
What is a p-chart?
A control chart for the proportion of defective parts in samples.
How is the UCL of a p-chart calculated?
UCL = p̄ + 3√(p̄(1 − p̄) ÷ n). In the example, ≈ 0.115.
Why is the LCL zero?
The calculation gave −0.0154 and a proportion cannot be negative, so 0 is used.
What is the difference between a p-chart and an np-chart?
The p-chart tracks the proportion; the np-chart tracks the number of defectives with a constant sample size.
When should c or u charts be used?
When counting defects rather than defective parts.
Sources
- MONTGOMERY, D. C. Introduction to Statistical Quality Control. Hoboken: Wiley.
- ISO 7870-2. Control charts: Shewhart control charts. Geneva: ISO.
- NIST/SEMATECH. e-Handbook of Statistical Methods. Gaithersburg: NIST.
Want the tools ready to use?
Download the free "Problem Solving Kit" e-book, with PDCA, A3, 5 Whys and Ishikawa.
Download the e-book
About the author
Lean Manufacturing & Behavioral Management Specialist
Over 20 years in the automotive and metalworking industries (GM and Dana), Lean Manufacturing practitioner since 2006. SENAI instructor and mentor in Brazil’s Brasil Mais Produtivo program, delivering consulting, training and audits for 50+ companies, combining quality, productivity and people development.