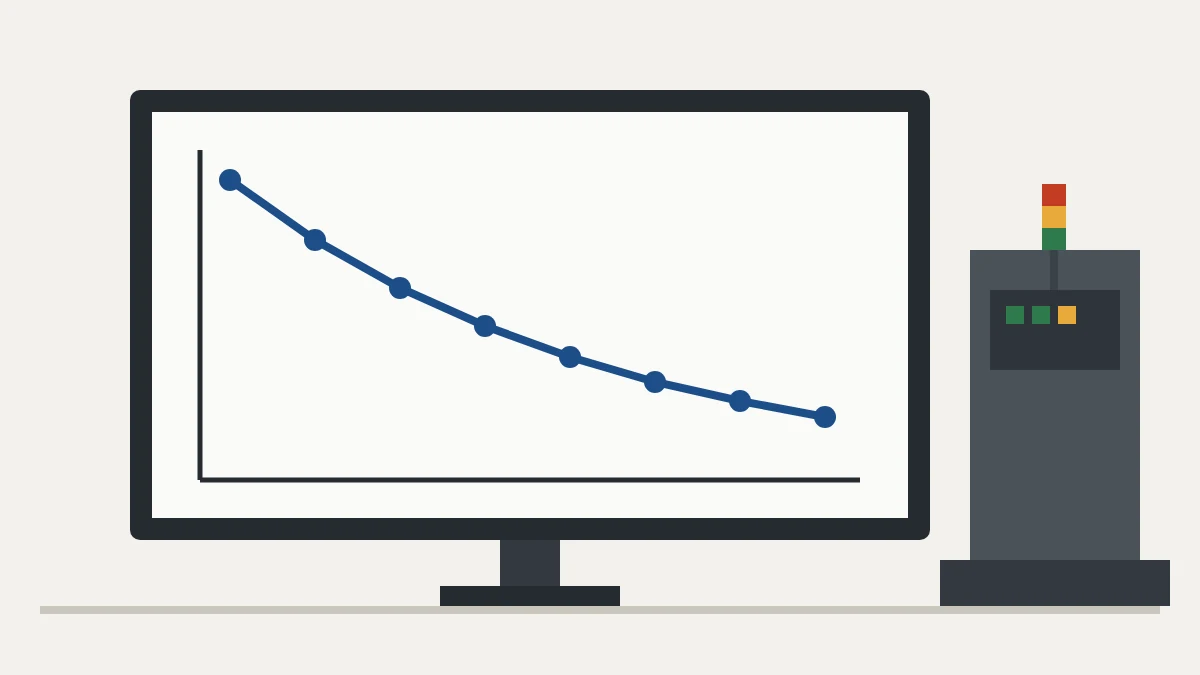
What the learning curve is
The learning curve describes how the time per unit falls as cumulative output grows, thanks to experience, standardization and process improvement.
T. P. Wright described it in 1936 in aircraft production: each time cumulative output doubled, the time per unit fell to a constant fraction.
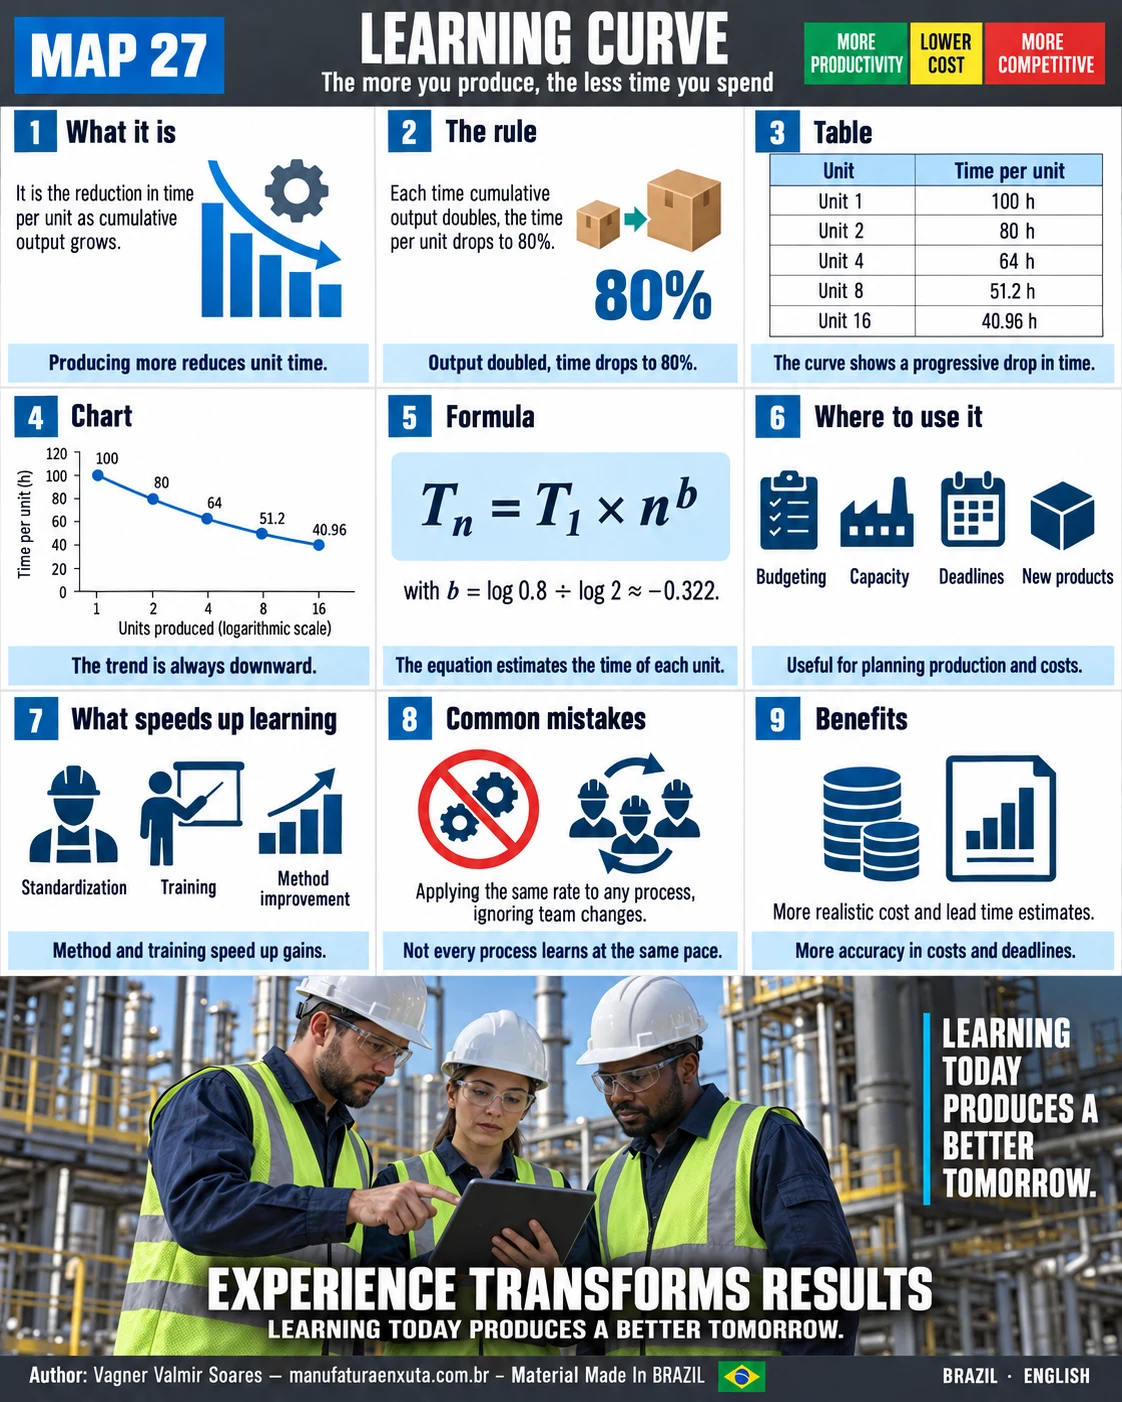
Learning curve visual map
The map shows the rule, the times from unit 1 to 16, the chart and the formula.
Formula
Tn = T1 × nb, with b = log(rate) ÷ log(2)
For an 80% rate: b = log(0.8) ÷ log(2) ≈ −0.322.
Example: first unit takes 100 hours
| Unit (cumulative output) | Time per unit (hours) |
|---|---|
| 1 | 100 |
| 2 | 80 |
| 4 | 64 |
| 8 | 51.2 |
| 16 | 40.96 |
Each time cumulative output doubles, the time per unit falls to 80% of the previous value. The drop is steep at first and then flattens.
Where to apply it
- Budgeting and pricing for repeat lots and contracts.
- Capacity planning during a product launch.
- Delivery lead time definition for the first units.
- Standard time: a time study done too early overstates the time.
What speeds up or slows down learning
Speeds it up: standardized work, training and continuous improvement of methods, tools and layout. Slows it down: product variation, method or equipment changes, high operator turnover and poor data.
Common mistakes
- Assuming a linear reduction in time.
- Ignoring external factors such as disruptions and changes.
- Using too little historical data.
- Not considering process stability.
- Applying the same curve to very different processes.
Frequently asked questions
What is a learning curve?
The reduction in time per unit as cumulative output increases.
What does an 80% learning curve mean?
Each time cumulative output doubles, the time per unit falls to 80% of the previous value.
What is the learning curve formula?
Tn = T1 × n^b, with b = log(rate) ÷ log(2).
How long does unit 16 take in the example?
100 × 0.8⁴ = 40.96 hours.
Who created the learning curve?
T. P. Wright described it in 1936 while studying aircraft production costs.
Sources
- WRIGHT, T. P. Factors affecting the cost of airplanes. Journal of the Aeronautical Sciences, v. 3, 1936.
- STEVENSON, W. J. Operations Management. New York: McGraw-Hill.
- HEIZER, J.; RENDER, B. Operations Management. Boston: Pearson.
Want the tools ready to use?
Download the free "Problem Solving Kit" e-book, with PDCA, A3, 5 Whys and Ishikawa.
Download the e-book
About the author
Lean Manufacturing & Behavioral Management Specialist
Over 20 years in the automotive and metalworking industries (GM and Dana), Lean Manufacturing practitioner since 2006. SENAI instructor and mentor in Brazil’s Brasil Mais Produtivo program, delivering consulting, training and audits for 50+ companies, combining quality, productivity and people development.