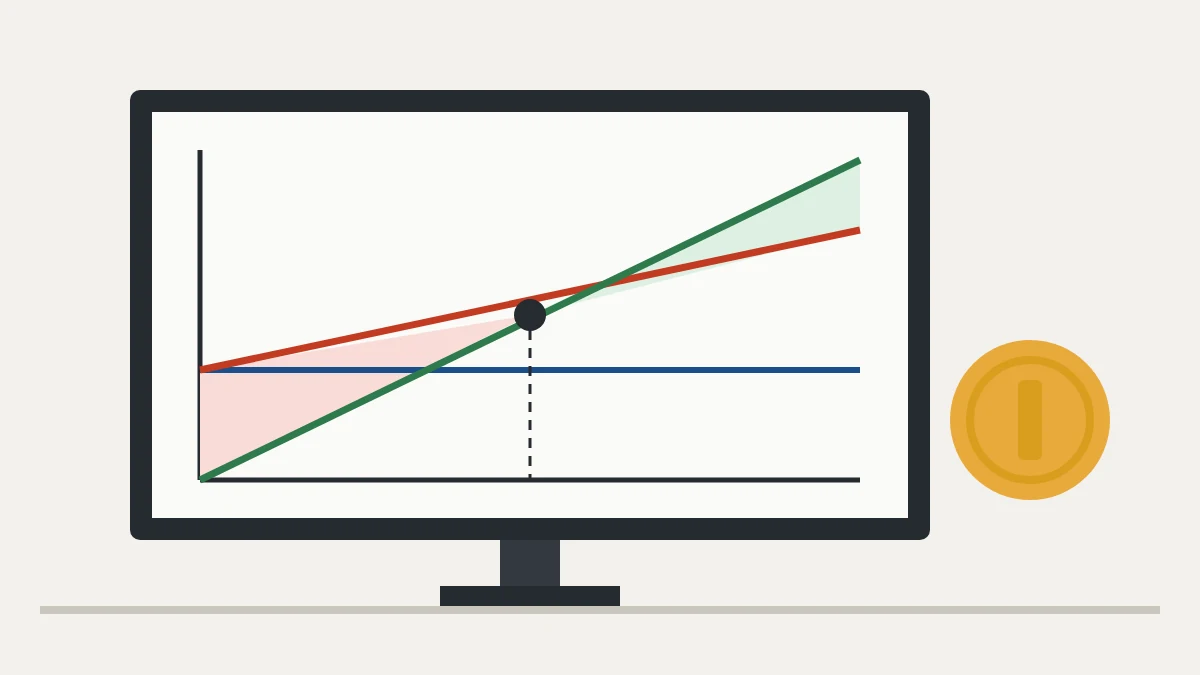
What the break-even point is
The break-even point is the sales volume at which revenue exactly covers total cost: no profit and no loss. Below it the company loses money; above it each unit sold generates profit.
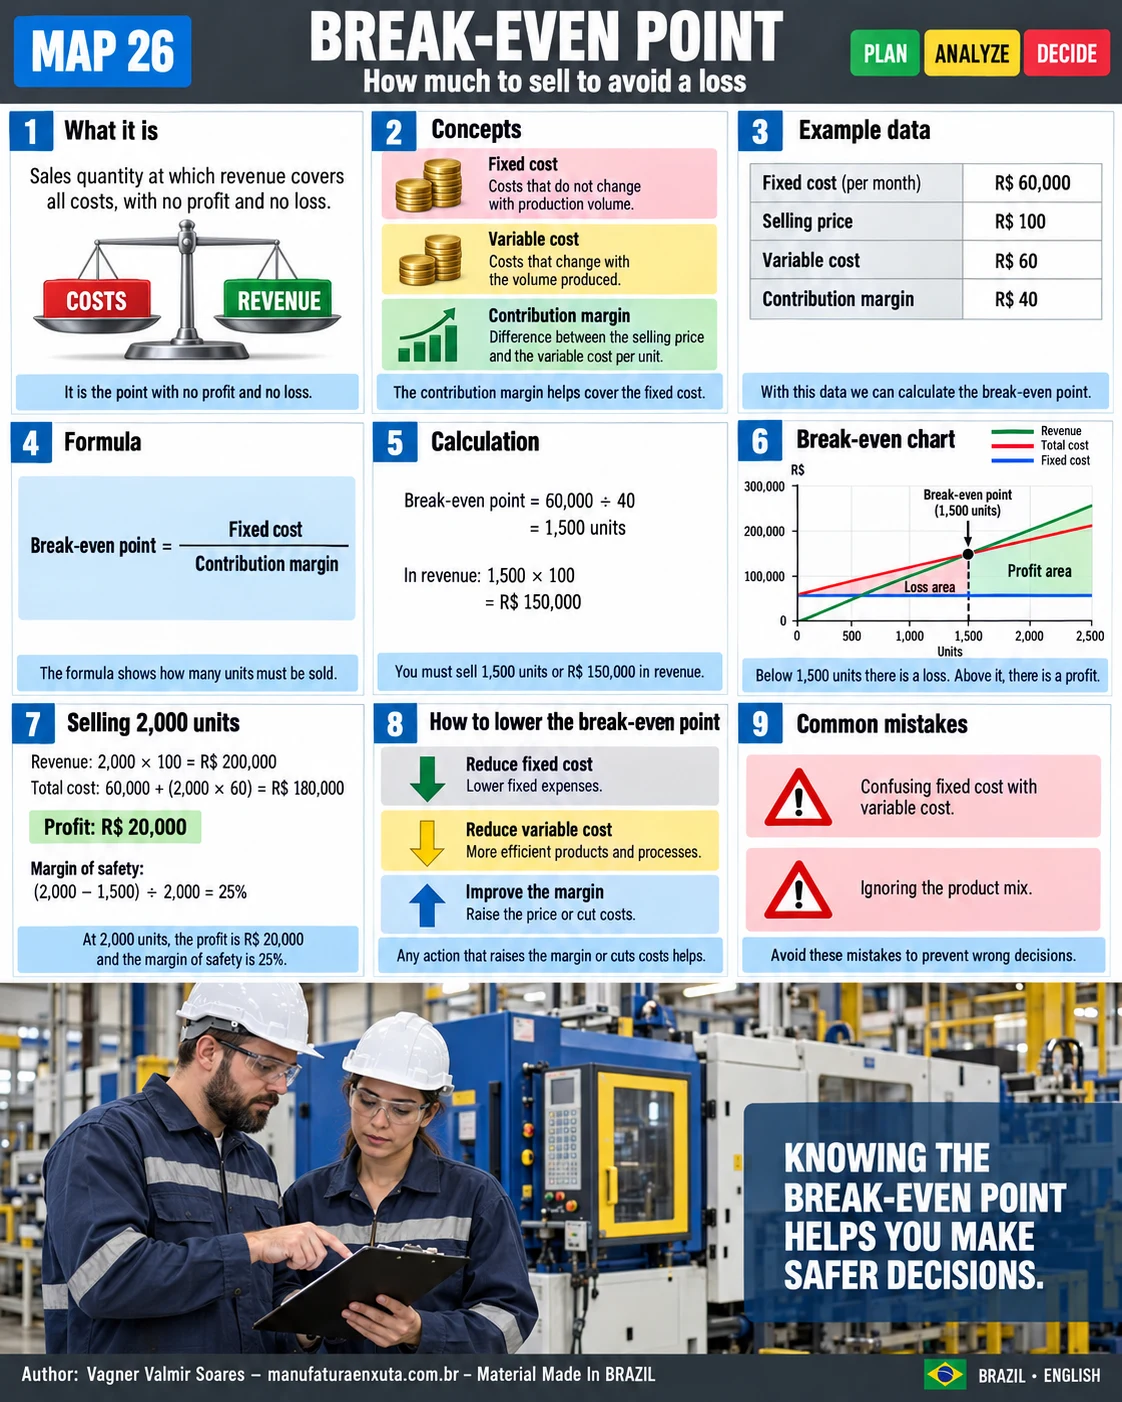
Break-even point visual map
The map covers the concepts, the calculation and the chart.
Fixed cost, variable cost and contribution margin
| Concept | What it is | Example |
|---|---|---|
| Fixed cost | Does not change with volume | Rent, administrative salaries, depreciation |
| Variable cost | Changes with each unit | Raw material, packaging, commissions |
| Contribution margin | Price − variable cost | What each unit contributes to cover fixed cost |
Worked example
| Data | Value |
|---|---|
| Monthly fixed cost | $60,000 |
| Selling price | $100 |
| Variable cost per unit | $60 |
| Contribution margin | $40 |
Break-even point = fixed cost ÷ contribution margin
$60,000 ÷ $40 = 1,500 units, or 1,500 × $100 = $150,000 in revenue.
Selling above break-even
| Selling 2,000 units | Value |
|---|---|
| Revenue | $200,000 |
| Total cost ($60,000 + 2,000 × $60) | $180,000 |
| Profit | $20,000 |
Margin of safety = (2,000 − 1,500) ÷ 2,000 = 25%: sales can drop 25% before the company starts losing money.
How to lower the break-even point
- Reduce fixed costs.
- Reduce variable costs, with less material waste and rework.
- Improve price or product mix.
- Raise productivity, for example with higher OEE.
For multi-year investments, combine break-even with NPV, IRR and payback.
Common mistakes
- Misclassifying fixed and variable costs.
- Ignoring product mix when selling several products.
- Confusing break-even with the profit target.
- Not updating costs.
Frequently asked questions
How do you calculate the break-even point?
Divide fixed cost by the unit contribution margin (price minus variable cost).
What is contribution margin?
Price minus variable cost per unit.
What is the break-even point in the example?
$60,000 ÷ $40 = 1,500 units, or $150,000 in revenue.
What is the margin of safety?
How far sales can fall before a loss: (sales − break-even) ÷ sales.
How can the break-even point be lowered?
By cutting fixed and variable costs or raising the margin per unit.
Sources
- HORNGREN, C. T. et al. Cost Accounting: A Managerial Emphasis. Boston: Pearson.
- GARRISON, R. H. et al. Managerial Accounting. New York: McGraw-Hill.
- NEWNAN, D. G. et al. Engineering Economic Analysis. New York: Oxford University Press.
Want to measure what really matters?
Download the free metrics e-book and track the losses in your operation.
Download the e-book
About the author
Lean Manufacturing & Behavioral Management Specialist
Over 20 years in the automotive and metalworking industries (GM and Dana), Lean Manufacturing practitioner since 2006. SENAI instructor and mentor in Brazil’s Brasil Mais Produtivo program, delivering consulting, training and audits for 50+ companies, combining quality, productivity and people development.