What the cost of quality is
The cost of quality adds up what a company spends to ensure quality and what it loses by not having it. The most widely used model is PAF: prevention, appraisal and failure, popularized by Armand Feigenbaum.
Cost of quality visual map
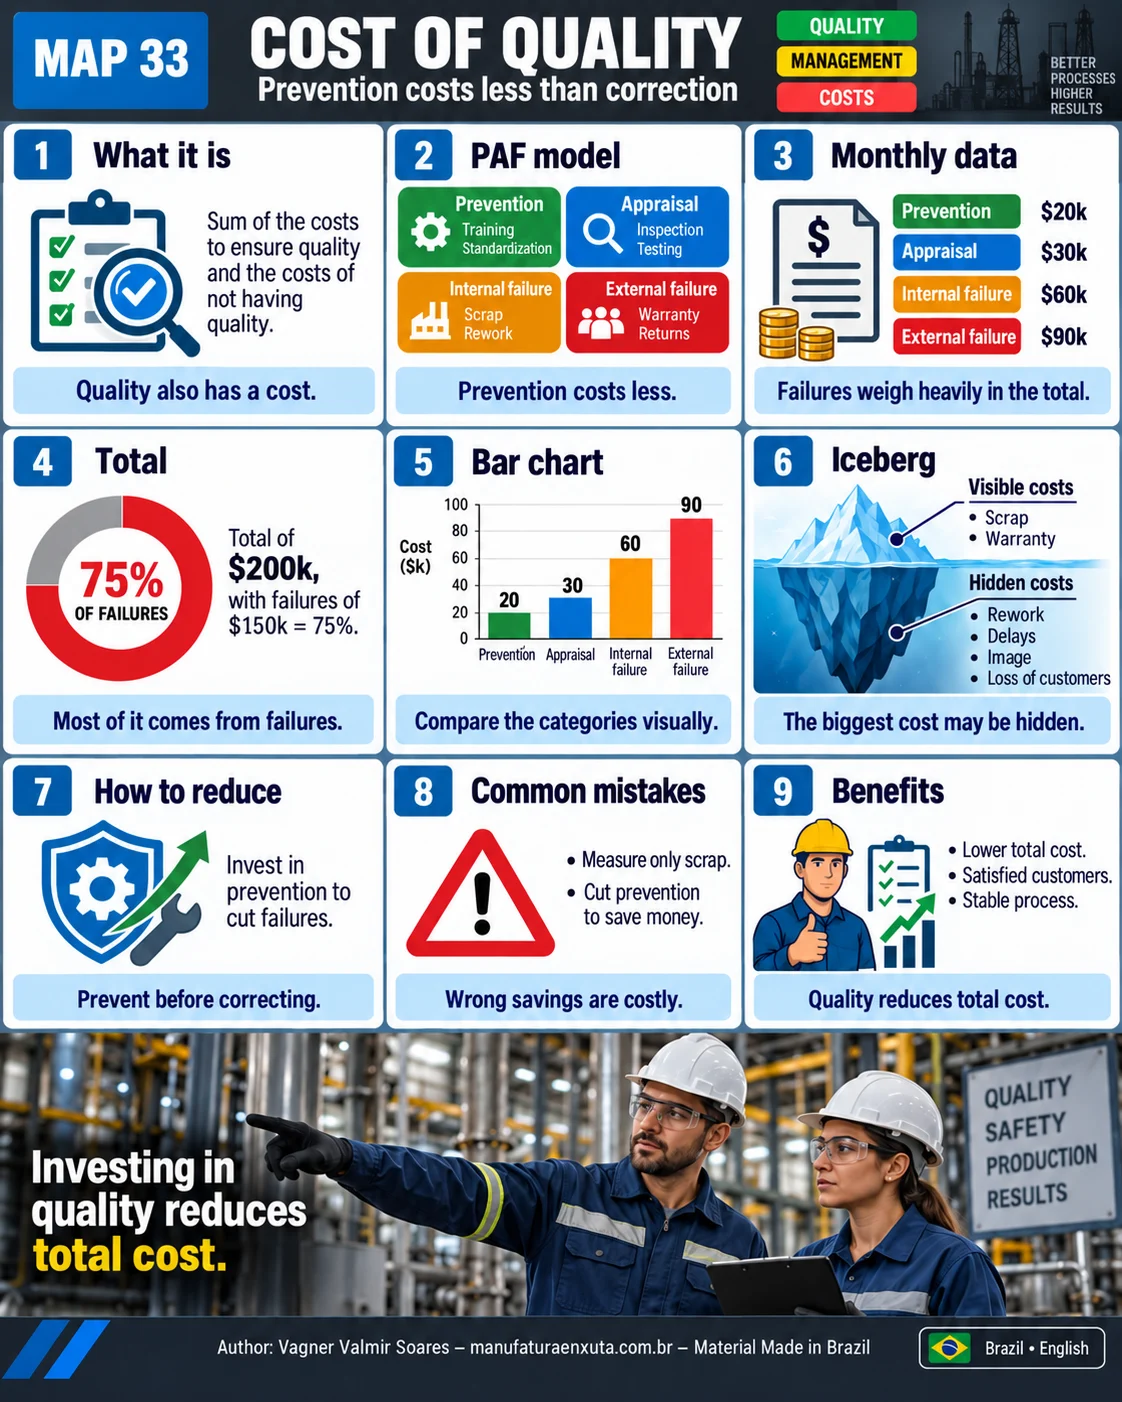
The map shows the 4 categories, the monthly example and the cost iceberg.
The 4 categories
| Category | What it is | Examples |
|---|---|---|
| Prevention | Keeping defects from happening | Training, quality planning, process improvement |
| Appraisal | Checking conformance | Inspections, tests, calibration, audits |
| Internal failure | Defects found before the customer | Scrap, rework, root cause analysis |
| External failure | Defects that reach the customer | Warranty, returns, lost customers |
Monthly example
| Category | Value | Share |
|---|---|---|
| Prevention | $20,000 | 10% |
| Appraisal | $30,000 | 15% |
| Internal failure | $60,000 | 30% |
| External failure | $90,000 | 45% |
| Total | $200,000 | 100% |
Failures add up to $150,000, or 75% of the cost of quality. The company spends more fixing than preventing.
The cost iceberg
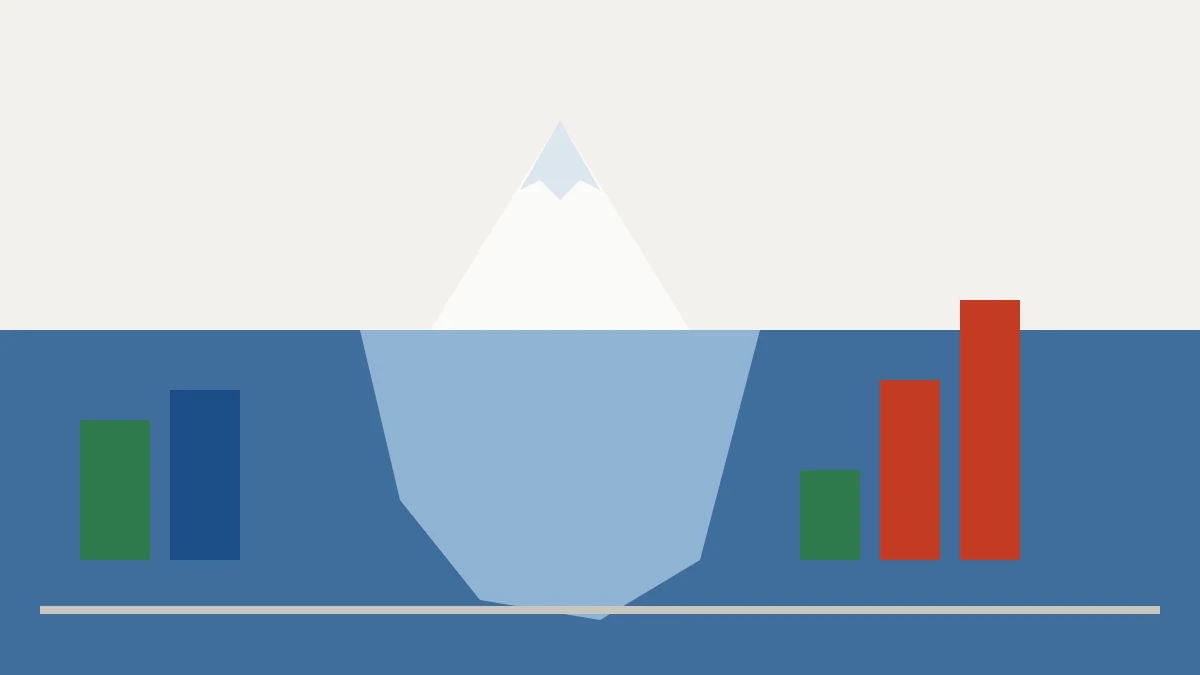
Scrap and warranty show up in reports. Below the waterline sit rework, delays, overtime, damage to image and dissatisfied customers, which are rarely counted. The real cost of poor quality is usually much higher than the visible part. RTY helps reveal part of this hidden factory.
How to reduce it
- Invest in prevention: every dollar well spent saves several in failures.
- Eliminate causes with A3, the 5 Whys and FMEA.
- Stabilize processes with SPC, which also reduces the need for appraisal.
- Track all 4 categories every month.
Common mistakes
- Measuring only scrap.
- Cutting prevention to save money in the short term.
- Underestimating hidden costs.
- Treating symptoms, not causes.
Frequently asked questions
What is the cost of quality?
The sum of prevention, appraisal and internal and external failure costs.
What is the PAF model?
Prevention, appraisal and failure: the classic way to classify quality costs.
What is the difference between internal and external failure?
Internal failures are found before the customer; external failures reach the customer.
How much do failures represent in the example?
$150,000 of $200,000, or 75%.
How can the cost of quality be reduced?
By investing in prevention and eliminating the causes of failures.
Sources
- FEIGENBAUM, A. V. Total Quality Control. New York: McGraw-Hill.
- JURAN, J. M.; DE FEO, J. A. Juran's Quality Handbook. New York: McGraw-Hill.
- CROSBY, P. B. Quality Is Free. New York: McGraw-Hill.
Want to measure what really matters?
Download the free metrics e-book and track the losses in your operation.
Download the e-book
About the author
Lean Manufacturing & Behavioral Management Specialist
Over 20 years in the automotive and metalworking industries (GM and Dana), Lean Manufacturing practitioner since 2006. SENAI instructor and mentor in Brazil’s Brasil Mais Produtivo program, delivering consulting, training and audits for 50+ companies, combining quality, productivity and people development.