
What NPV, IRR and payback are for
Buying a machine, automating a line or expanding a plant all trade money today for gains later. Net present value (NPV), internal rate of return (IRR) and payback are the engineering economics tools that compare those future inflows with the investment, taking the time value of money into account.
Everything rests on the MARR (minimum attractive rate of return), the lowest return the company accepts given its cost of capital and the project's risk.
NPV, IRR and payback visual map
The map brings together the example's cash flow, the present value table, the formulas, the results and a comparison of the indicators.
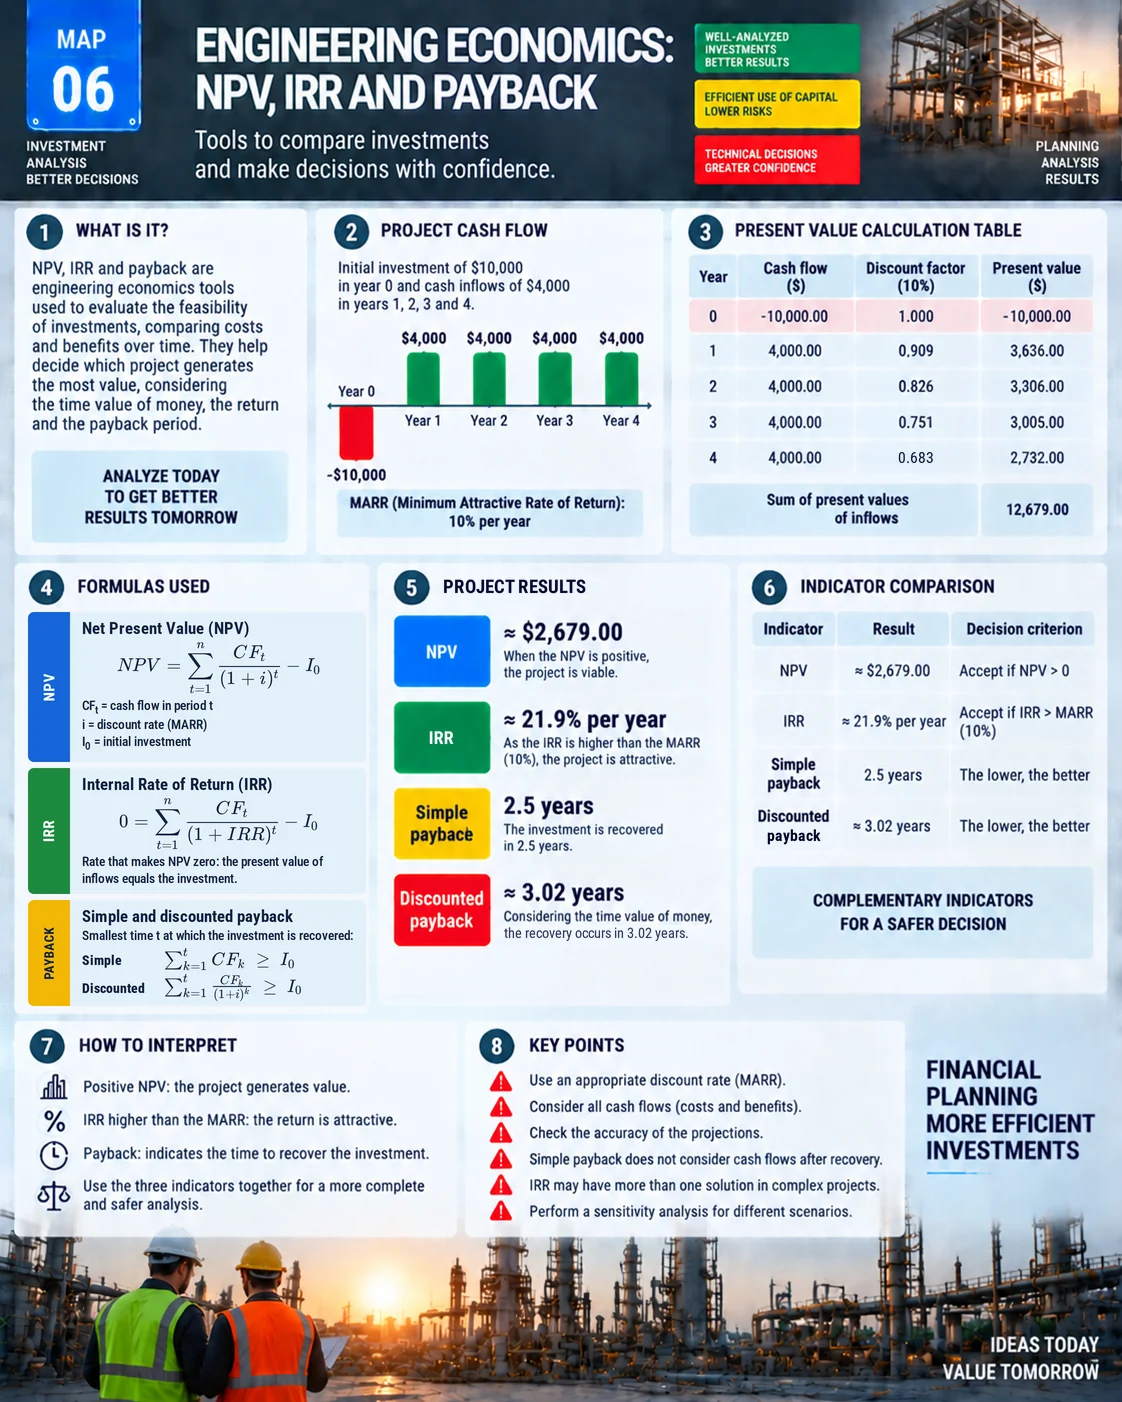
Example: a $10,000 investment
A project requires $10,000 today and generates inflows of $4,000 a year for 4 years. The MARR is 10% a year.
| Year | Cash flow | Factor (10%) | Present value |
|---|---|---|---|
| 0 | −10,000 | 1.000 | −10,000 |
| 1 | 4,000 | 0.909 | 3,636 |
| 2 | 4,000 | 0.826 | 3,306 |
| 3 | 4,000 | 0.751 | 3,005 |
| 4 | 4,000 | 0.683 | 2,732 |
| Total | 2,679 |
NPV: net present value
NPV = Σ CFt ÷ (1 + i)t − I0
NPV brings every inflow back to today, discounted at the MARR, and subtracts the investment. In the example the inflows are worth $12,679 today and the NPV is about $2,679. A positive NPV means the project earns the MARR and creates extra value; a negative NPV means it destroys value.
IRR: internal rate of return
0 = Σ CFt ÷ (1 + IRR)t − I0
IRR is the rate that makes NPV equal to zero. In the example it is about 21.9% a year, well above the 10% MARR, so the project is accepted. IRR is easy to communicate but has limits: cash flows that change sign more than once can produce multiple IRRs, and IRR says nothing about the size of the gain.
Simple and discounted payback
Simple payback measures how long the inflows take to return the investment, without discounting: 10,000 ÷ 4,000 = 2.5 years.
Discounted payback does the same with present values: by the end of year 3, $9,947 has been recovered; the remaining $53 is covered just over a week into year 4. The result is about 3.02 years. Payback measures liquidity and risk but ignores everything after the investment is recovered.
Comparison and decision rules
| Indicator | Rule | Strength | Limitation |
|---|---|---|---|
| NPV | NPV > 0, accept | Shows the gain in money | Depends on the chosen MARR |
| IRR | IRR > MARR, accept | Easy to compare with the MARR | There may be more than one IRR |
| Simple payback | Shorter is better | Simple and intuitive | Ignores the time value of money |
| Discounted payback | Shorter is better | Accounts for the MARR | Ignores cash flows after recovery |
When the indicators disagree while ranking projects, NPV is the safest criterion because it measures the value created.
How to calculate it in Excel
- NPV: =NPV(10%,B2:B5)+B1, with the negative investment in B1 and the inflows in B2:B5.
- IRR: =IRR(B1:B5).
- Sensitivity: rerun NPV at other rates. At 15% it drops to about $1,420; at the IRR it reaches zero.
Applications in manufacturing
- Buying and replacing machines.
- Capacity expansion.
- Automation and Industry 4.0 projects.
- Continuous improvement projects with measurable gains, such as shorter changeovers or less scrap.
Lean projects can go through the same analysis: an OEE gain becomes cash flow when it avoids overtime or postpones buying another machine.
Watch-outs
- Optimistic cash flows with no data behind them.
- Forgetting maintenance, training, energy and tax costs.
- A MARR that does not reflect the project's risk.
- Comparing projects with different horizons without adjustment.
- Deciding on a single indicator.
Frequently asked questions
What is NPV?
Net present value: the sum of future inflows discounted at the MARR minus the initial investment. A positive NPV means the project creates value.
What is IRR?
Internal rate of return, the rate that makes NPV zero. If it is higher than the MARR, the project is attractive.
What is the difference between simple and discounted payback?
Simple payback ignores the time value of money; discounted payback uses cash flows brought to present value at the MARR.
What is MARR?
The minimum attractive rate of return, the lowest return a company requires to accept an investment.
Which indicator should drive the decision?
Use all three together; when they conflict while comparing projects, NPV is the most reliable criterion.
Sources
- BLANK, L.; TARQUIN, A. Engineering Economy. New York: McGraw-Hill.
- NEWNAN, D. G.; ESCHENBACH, T. G.; LAVELLE, J. P. Engineering Economic Analysis. New York: Oxford University Press.
- PARK, C. S. Contemporary Engineering Economics. Hoboken: Pearson.
Want to measure what your improvements are worth?
Download the free metrics e-book and turn improvements into numbers.
Download the e-book
About the author
Lean Manufacturing & Behavioral Management Specialist
Over 20 years in the automotive and metalworking industries (GM and Dana), Lean Manufacturing practitioner since 2006. SENAI instructor and mentor in Brazil’s Brasil Mais Produtivo program, delivering consulting, training and audits for 50+ companies, combining quality, productivity and people development.