- What inventory management is
- Inventory management visual map
- Where inventory models come from
- Types of inventory
- How to calculate the reorder point
- How to calculate safety stock
- How to calculate the economic order quantity
- ABC analysis: where to focus
- KPIs: turns, days of supply and accuracy
- The lean view: inventory as a symptom
- Industrial examples
- Common mistakes and benefits
- Steps and checklist
- Frequently asked questions
What inventory management is
Inventory is cash in the shape of material. Too little stops the line and makes customers wait; too much takes up space, ages and ties up cash. Inventory management means deciding, item by item, how much to hold, when to replenish and how much to order, against a defined service level.
Each decision has a simple formula: the reorder point says when, safety stock protects against uncertainty and the economic order quantity (EOQ) says how much. ABC analysis tells you where to spend control effort.
Inventory management visual map
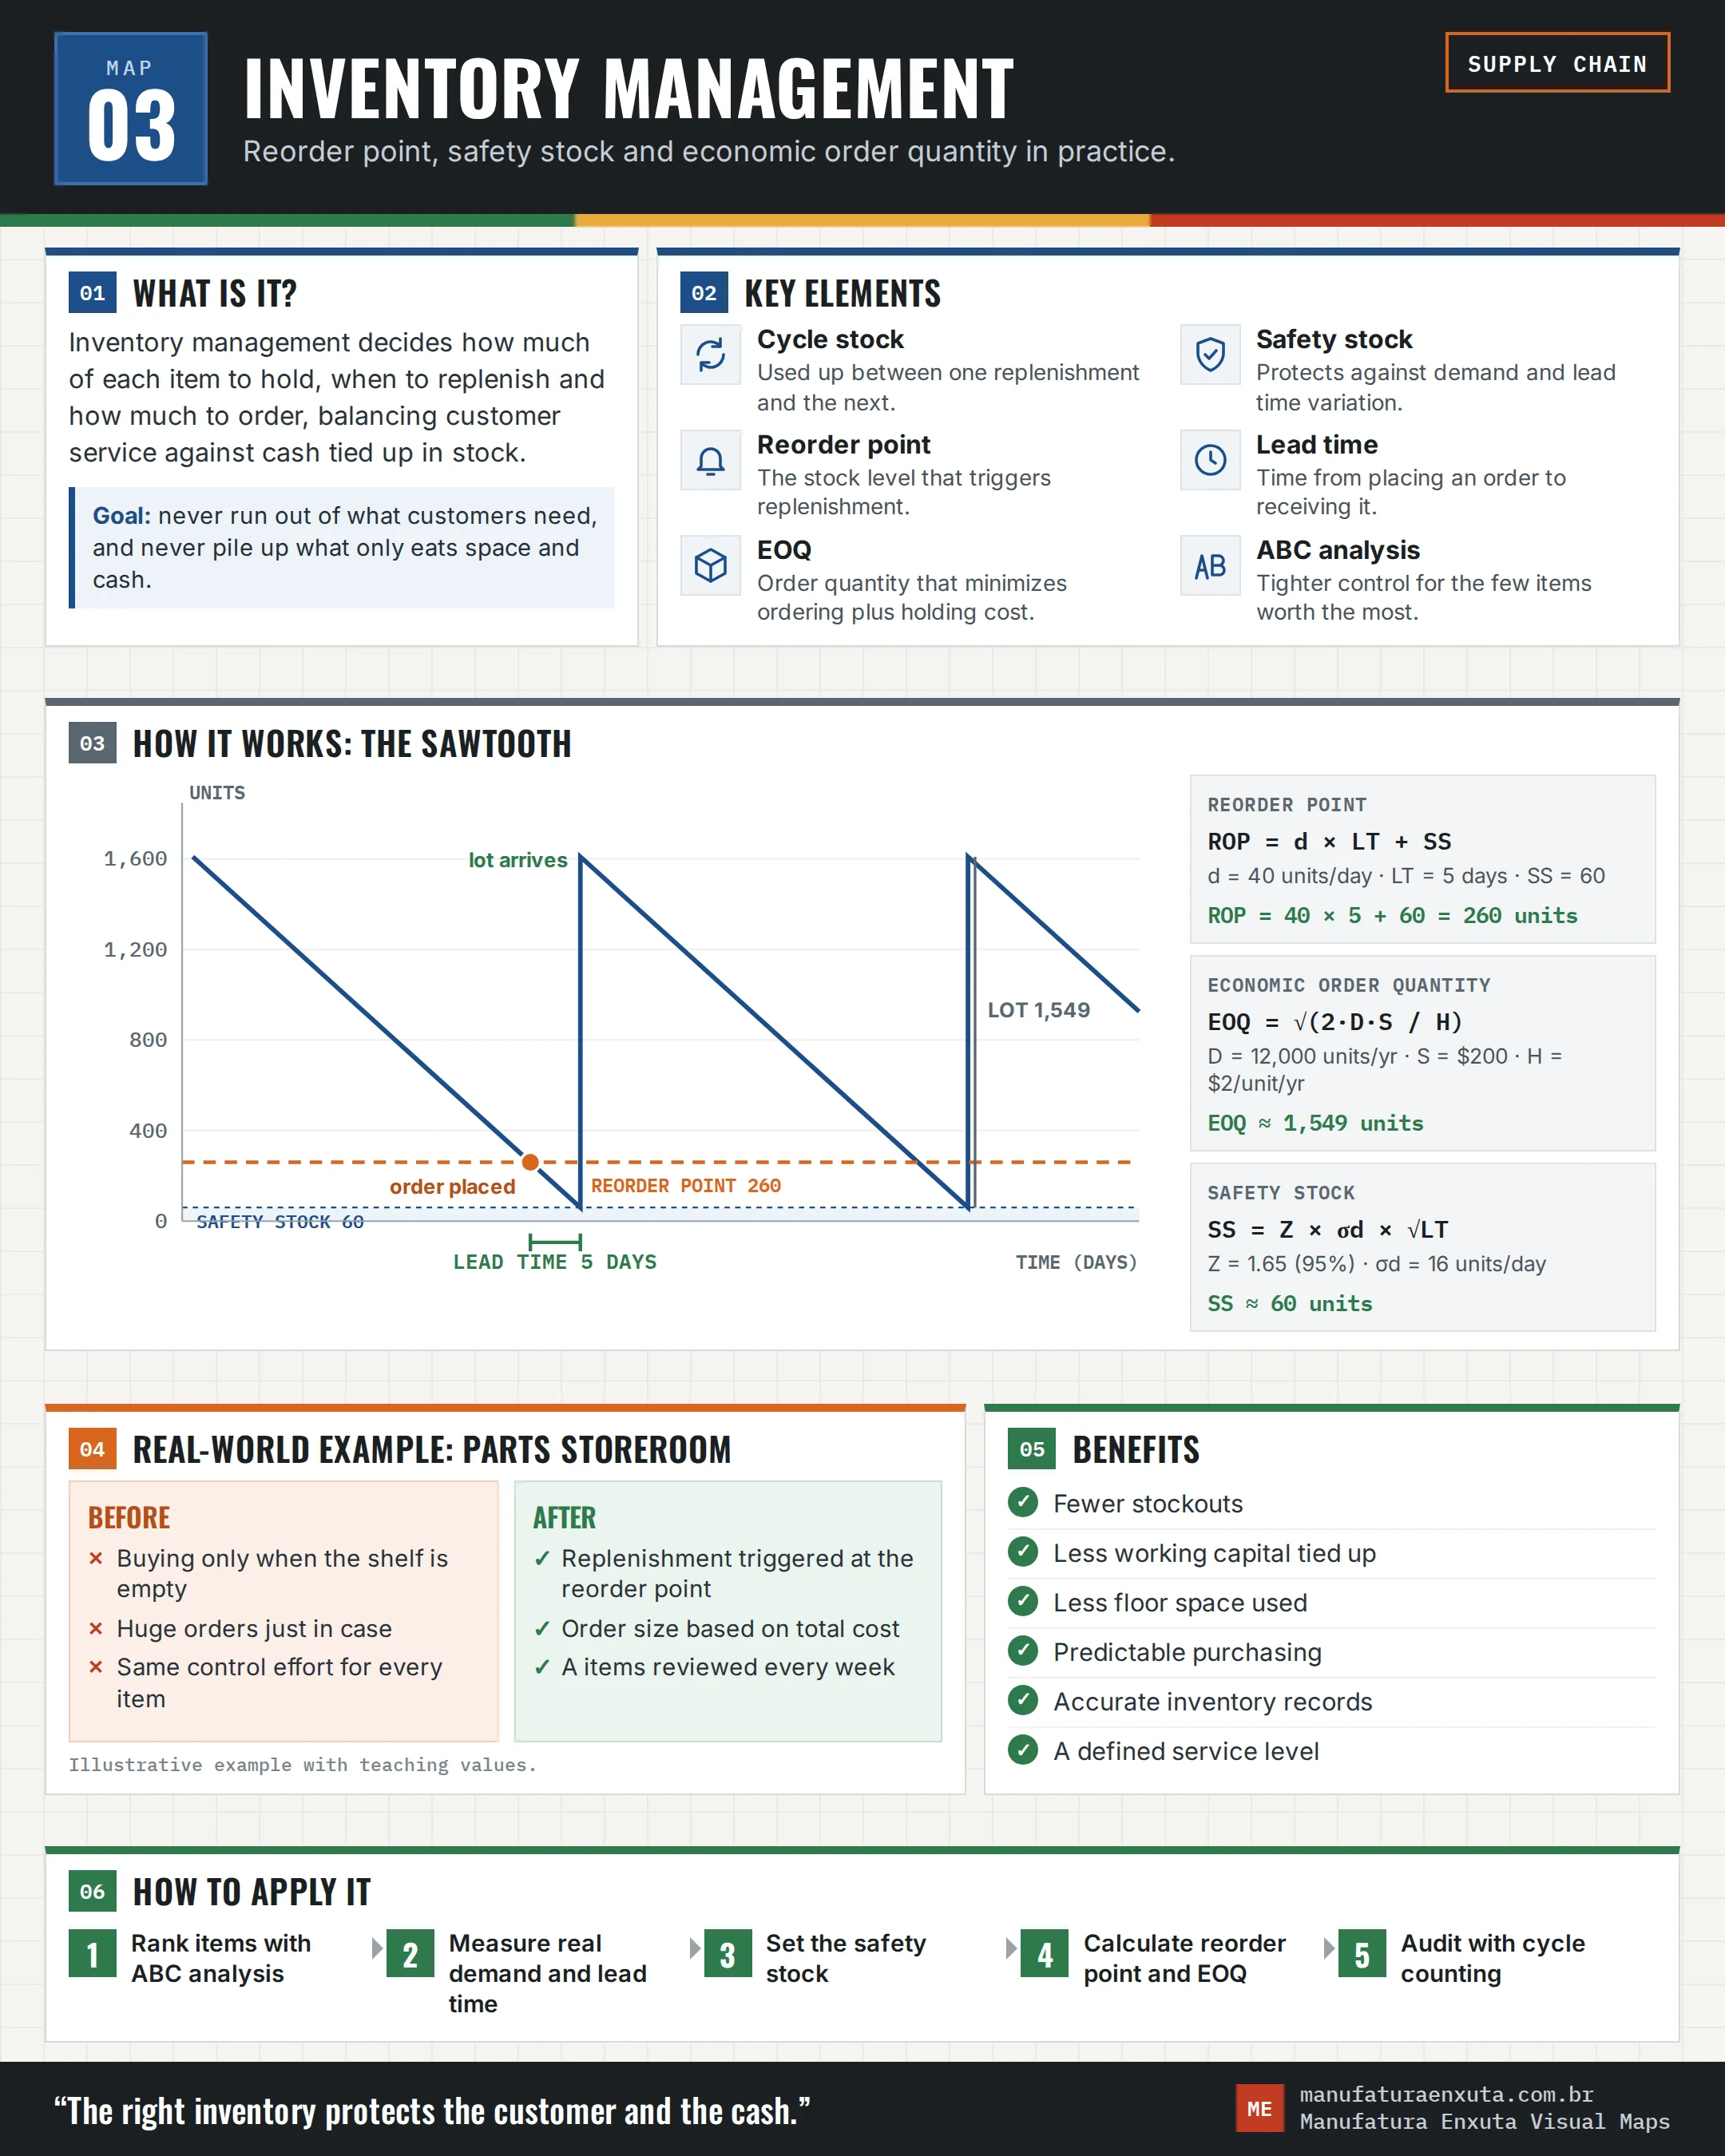
The map shows the sawtooth chart with the reorder point, safety stock and lead time, the three formulas with the same worked example used in this article, and the steps.
Where inventory models come from
The EOQ formula was published by Ford W. Harris in 1913 in "How many parts to make at once" and later became known as the Wilson formula. Reorder point and safety stock models came from statistics applied to logistics throughout the 20th century.
The Toyota Production System added another lens: excess inventory is one of the wastes, because it hides problems such as breakdowns, long changeovers and unreliable suppliers. The two views complement each other: the formulas size the stock you need, and lean attacks the reasons you need it.
Types of inventory
| Type | Purpose |
|---|---|
| Cycle stock | Covers usage between one replenishment and the next |
| Safety stock | Protects against demand and lead time variation |
| In transit | Material already bought and on its way |
| Work in process | Material between production steps |
| Anticipation or seasonal | Built ahead of a sales peak or a shutdown |
| Finished goods | Ready to ship |
How to calculate the reorder point
Reorder point = daily demand × lead time + safety stock
Example: a component is used at 40 units per day, the supplier delivers in 5 days and safety stock is 60 units. ROP = 40 × 5 + 60 = 260 units. When on hand plus on order drops to 260, a new order is placed.
The detail that causes most stockouts is using the contract lead time instead of the real one, measured from order release to material available on the shelf.
How to calculate safety stock
Safety stock = Z × σd × √LT
σd is the standard deviation of daily demand, LT the lead time in days and Z the factor for the target service level:
| Service level | Z |
|---|---|
| 90% | 1.28 |
| 95% | 1.65 |
| 97.5% | 1.96 |
| 99% | 2.33 |
In the example, with σd = 16 units per day and a 95% service level: 1.65 × 16 × √5 ≈ 59, rounded up to 60 units. If the lead time also varies, the formula must include that variation and safety stock grows. Moving from 95% to 99% service costs more stock than it seems: Z goes from 1.65 to 2.33.
How to calculate the economic order quantity
EOQ = √(2 × D × S ÷ H)
D is annual demand, S the cost of placing an order and H the cost of holding one unit for a year. In the example, D = 12,000 units per year (40 per day over 300 working days), S = $200 and H = $2: EOQ = √(2 × 12,000 × 200 ÷ 2) = √2,400,000 ≈ 1,549 units, rounded to 1,550.
That means almost 8 orders per year. Annual ordering cost (about $1,550) and holding cost (about $1,550) are equal, which is exactly the minimum total cost point. The curve is flat near the optimum: rounding to 1,550 or to the supplier's pack size barely changes the cost.
ABC analysis: where to focus
| Class | Typical profile | Suggested control |
|---|---|---|
| A | Few items, most of the annual usage value | Weekly review, frequent counts, calculated safety stock |
| B | Middle items | Biweekly or monthly review |
| C | Many low-value items | Simple rules such as two-bin kanban |
The 20% of items with 80% of the value split is a rule of thumb, not a law. Build the curve from your own annual usage value.
KPIs: turns, days of supply and accuracy
| KPI | Calculation | In the example |
|---|---|---|
| Average inventory | Order quantity ÷ 2 + safety stock | 1,549 ÷ 2 + 60 ≈ 835 units |
| Inventory turns | Usage in the period ÷ average inventory | 12,000 ÷ 835 ≈ 14.4 turns per year |
| Days of supply | Inventory ÷ average daily usage | 835 ÷ 40 ≈ 21 days |
| Record accuracy | Items whose physical count matches the system ÷ items counted | A common target is above 95% |
Without accurate records, no formula works: the reorder point fires on stock that isn't there. Cycle counting, a few items a day and A items more often, keeps records reliable without shutting down the storeroom.
The lean view: inventory as a symptom
Lean literature often compares inventory to the water level in a river that covers the rocks: lower the level and the problems show. The answer is not to slash stock overnight but to cut lead times, lot sizes and variation, then lower inventory safely.
On the shop floor the reorder point becomes kanban: the card that comes back when a container is used is the replenishment trigger, and the supermarket holds the calculated stock. Just-in-time is the next step, with ever smaller lots.
Industrial examples
- Maintenance storeroom: critical slow-moving spares with high safety stock; C items in two bins.
- Auto parts distributor: ABC by value and by pick frequency to decide slotting in the warehouse.
- Food: shelf life caps the order quantity, and picking follows first expired, first out.
- E-commerce: days of supply and stockouts tracked daily per SKU, because an out-of-stock item disappears from the store.
Common mistakes and benefits
- Ignoring the real replenishment lead time.
- The same safety stock for every item.
- Overbuying for a discount without counting holding cost.
- Ignoring demand variation.
- System records that don't match the shelf.
- Parameters calculated once and never reviewed.
Done well, inventory management brings fewer stockouts, less working capital tied up, less space used, predictable purchasing and a service level you chose rather than one you got by chance.
Steps and checklist
- Rank items with ABC analysis.
- Measure real demand and lead time for A and B items.
- Set the service level and calculate safety stock.
- Calculate the reorder point and order quantity.
- Start cycle counting and track turns, days of supply and accuracy.
- ABC analysis updated last quarter.
- Real lead time measured.
- Service level defined by class.
- Parameters loaded into the system.
- Record accuracy above target.
- Parameters reviewed on a schedule.
Frequently asked questions
How do you calculate the reorder point?
Multiply daily demand by the replenishment lead time and add safety stock. With 40 units per day, a 5-day lead time and 60 units of safety stock, the reorder point is 260.
What is the safety stock formula?
A common form is Z × standard deviation of daily demand × square root of lead time, where Z depends on the target service level.
What is the economic order quantity?
The order size that minimizes the sum of ordering and holding costs: the square root of 2 × annual demand × order cost ÷ holding cost.
What are inventory turns?
How many times inventory is renewed in a period: usage divided by average inventory.
Is lean against holding inventory?
No. Lean fights excess inventory that hides problems, but uses calculated stock in supermarkets and kanban loops.
Sources
- HARRIS, F. W. How many parts to make at once. Factory, The Magazine of Management, 1913.
- SILVER, E. A.; PYKE, D. F.; THOMAS, D. J. Inventory and Production Management in Supply Chains. Boca Raton: CRC Press.
- Lean Enterprise Institute. Supermarket. https://www.lean.org/lexicon-terms/supermarket/
- Lean Enterprise Institute. Kanban. https://www.lean.org/lexicon-terms/kanban/
Want to swap reorder points for kanban?
Download the free pull production e-book, with supermarkets, kanban and leveling.
Download the e-book
About the author
Lean Manufacturing & Behavioral Management Specialist
Over 20 years in the automotive and metalworking industries (GM and Dana), Lean Manufacturing practitioner since 2006. SENAI instructor and mentor in Brazil’s Brasil Mais Produtivo program, delivering consulting, training and audits for 50+ companies, combining quality, productivity and people development.