
What demand forecasting is
Demand forecasting estimates how much customers will order in the future. It feeds the production plan, purchasing, inventory and capacity. Every forecast is wrong; the goal is to be wrong by little, measure the error and decide with it.
Demand forecasting visual map
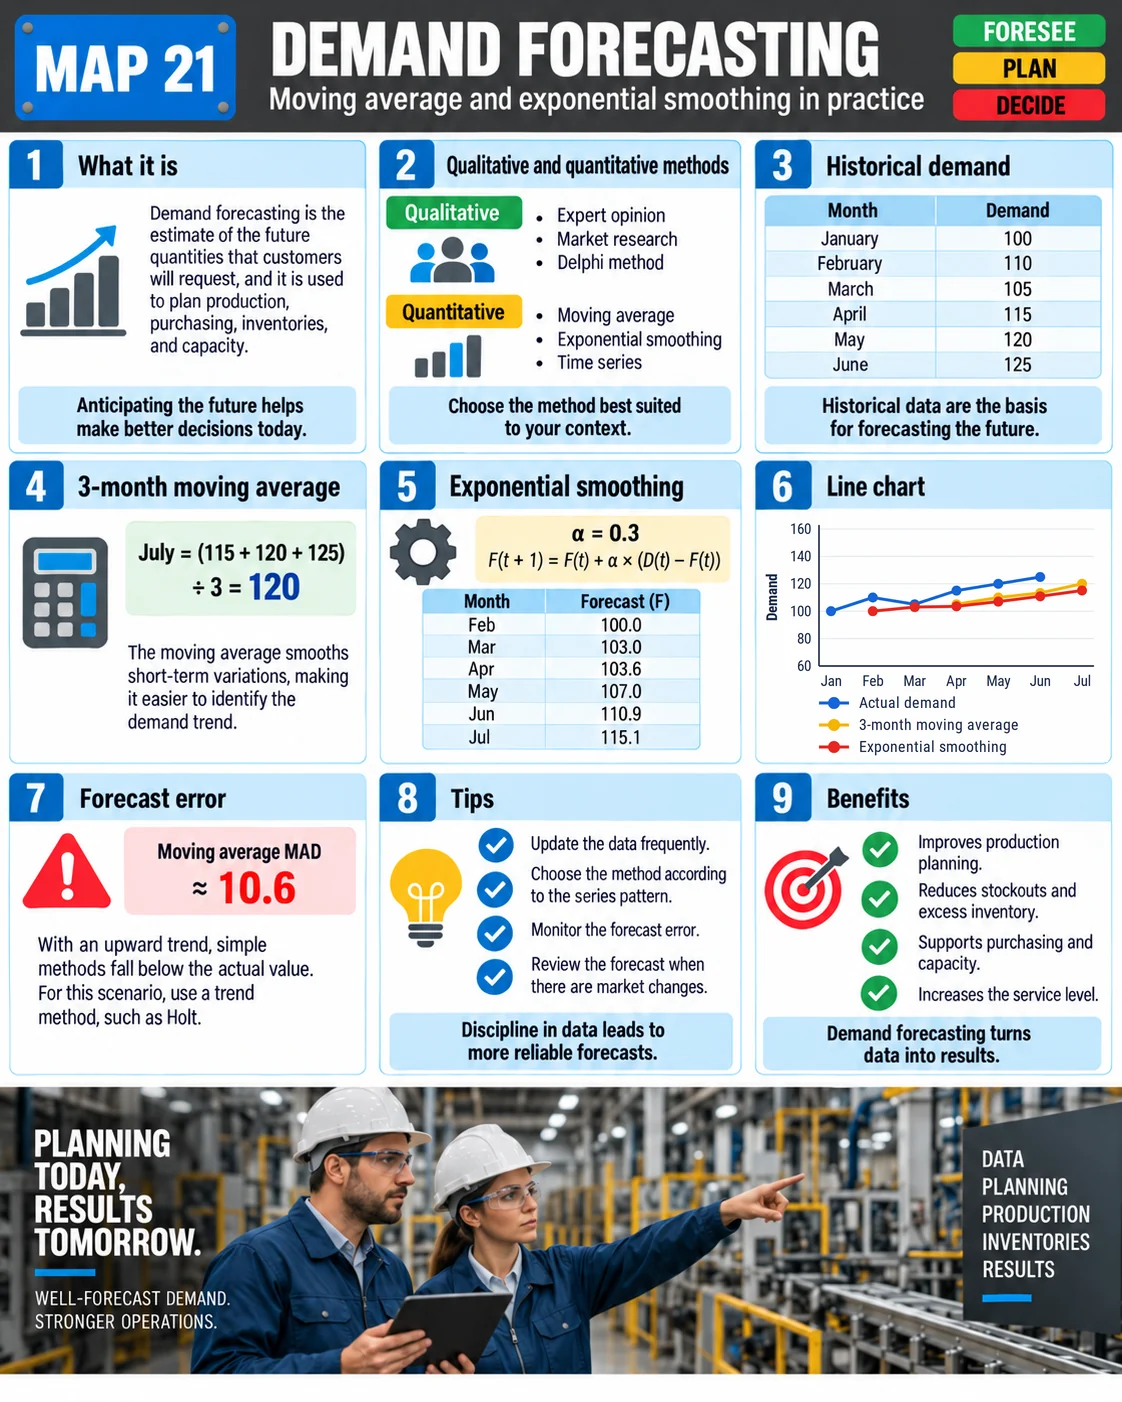
The map brings together the methods, the historical series, both calculations, the comparison chart and the forecast error.
Qualitative and quantitative methods
| Type | Examples | When to use |
|---|---|---|
| Qualitative | Expert opinion, market research, Delphi method | New products with no history |
| Quantitative | Moving average, exponential smoothing, time series with trend and seasonality | Products with reliable history |
Example: demand from January to June
| Month | Jan | Feb | Mar | Apr | May | Jun |
|---|---|---|---|---|---|---|
| Demand | 100 | 110 | 105 | 115 | 120 | 125 |
3-month moving average
July forecast = (115 + 120 + 125) ÷ 3 = 120
A moving average smooths short-term swings. The more periods it includes, the steadier it is and the slower it reacts to change.
Exponential smoothing (α = 0.3)
F(t+1) = F(t) + α × (D(t) − F(t))
| Month | Feb | Mar | Apr | May | Jun | Jul |
|---|---|---|---|---|---|---|
| Forecast | 100.0 | 103.0 | 103.6 | 107.0 | 110.9 | 115.1 |
The forecast starts from January's demand and each month corrects 30% of the previous error. A higher α reacts faster; a lower one filters more noise.
Measuring error: MAD
MAD = average of the absolute errors
The moving average forecasts for April, May and June were 105, 110 and 113.3 against demand of 115, 120 and 125. The errors were 10, 10 and 11.7: MAD ≈ 10.6. Both methods stayed below actual demand because demand is trending up. In that case use a trend method such as Holt's, or a regression.
The NIST e-Handbook covers the theory of exponential smoothing and its trend and seasonal variants.
Practical tips
- Update the data often and clean out one-off events.
- Pick the method that matches the pattern (level, trend, seasonality).
- Track error and bias every month.
- Review the forecast with sales when the market changes.
- Use the forecast to plan in production planning and control, and pull execution from real consumption with kanban.
Frequently asked questions
What is demand forecasting?
Estimating how much customers will order, used to plan production, purchasing, inventory and capacity.
How do you calculate a moving average forecast?
Add the demand of the last n periods and divide by n. In the example, (115 + 120 + 125) ÷ 3 = 120.
How does exponential smoothing work?
The new forecast is the previous one plus α times the error: F(t+1) = F(t) + α × (D(t) − F(t)).
What is MAD?
Mean absolute deviation, the average of the forecast errors in absolute value.
Which method should I use when demand is growing?
A trend method such as Holt's, because moving averages and simple smoothing lag behind actual demand.
Sources
- NIST/SEMATECH e-Handbook of Statistical Methods. Exponential Smoothing. https://www.itl.nist.gov/div898/handbook/pmc/section4/pmc431.htm
- HYNDMAN, R. J.; ATHANASOPOULOS, G. Forecasting: Principles and Practice. Melbourne: OTexts.
- STEVENSON, W. J. Operations Management. New York: McGraw-Hill.
Plan with data, produce to consumption.
Download the free pull production e-book, with kanban, supermarkets and leveling.
Download the e-book
About the author
Lean Manufacturing & Behavioral Management Specialist
Over 20 years in the automotive and metalworking industries (GM and Dana), Lean Manufacturing practitioner since 2006. SENAI instructor and mentor in Brazil’s Brasil Mais Produtivo program, delivering consulting, training and audits for 50+ companies, combining quality, productivity and people development.