
What ABC analysis is
ABC analysis ranks inventory items by financial importance. It shows that a few items account for most of the value moved, so each item can get the attention it deserves: tight control where the money is, simple control where it is not.
It follows the same logic as the Pareto chart: the vital few and the trivial many.
ABC analysis visual map
The map shows the steps, the 10-item table, the cumulative curve and how to manage each class.
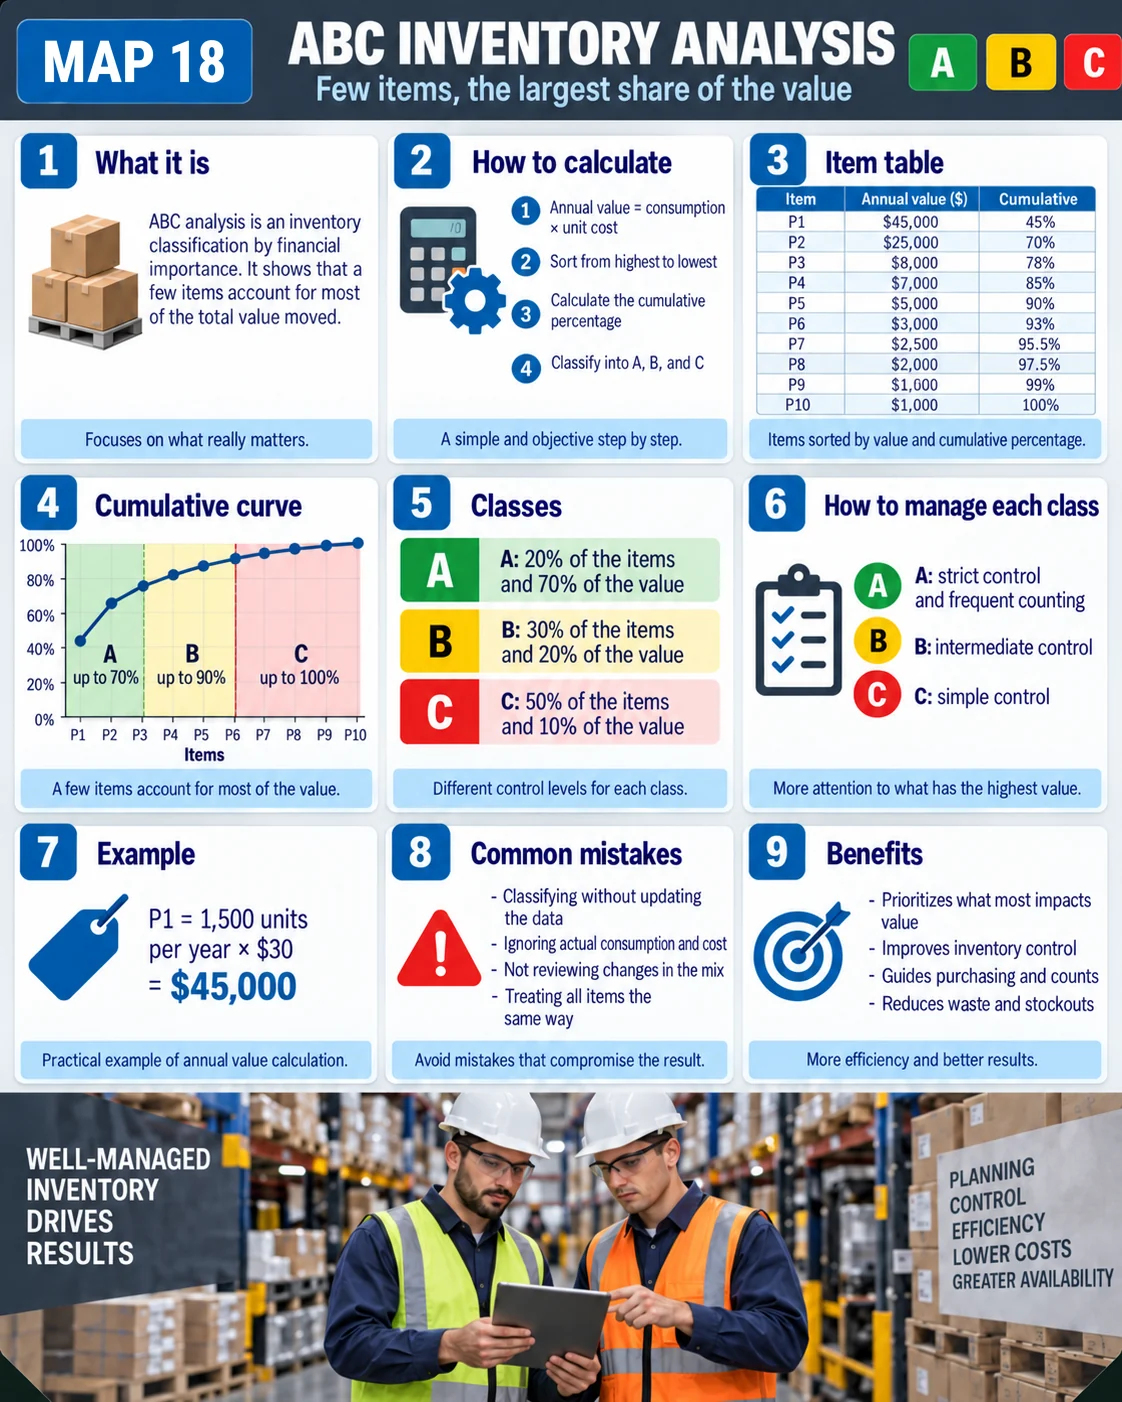
How to calculate it, step by step
- Calculate the annual value of each item: annual usage × unit cost.
- Sort from highest to lowest value.
- Calculate each item's percentage and the cumulative percentage.
- Classify into A, B and C using cumulative cut-offs.
Annual value = annual usage × unit cost
Item P1: 1,500 units per year × $30 = $45,000.
Example: 10 items and $100,000 a year
| Item | Annual value ($) | Cumulative | Class |
|---|---|---|---|
| P1 | 45,000 | 45% | A |
| P2 | 25,000 | 70% | A |
| P3 | 8,000 | 78% | B |
| P4 | 7,000 | 85% | B |
| P5 | 5,000 | 90% | B |
| P6 | 3,000 | 93% | C |
| P7 | 2,500 | 95.5% | C |
| P8 | 2,000 | 97.5% | C |
| P9 | 1,500 | 99% | C |
| P10 | 1,000 | 100% | C |
| Class | Items | Value |
|---|---|---|
| A | 20% (2 items) | 70% |
| B | 30% (3 items) | 20% |
| C | 50% (5 items) | 10% |
Two items hold 70% of the money in inventory. A counting error or stockout on P1 matters far more than a problem with P10.
How to manage each class
| Class | Control | In practice |
|---|---|---|
| A | Tight | Frequent cycle counts, careful forecasting, calculated safety stock, close supplier negotiation |
| B | Moderate | Periodic review, quarterly counts, parameters reviewed twice a year |
| C | Simple | Larger lots, min-max or two-bin kanban replenishment, annual count |
Replenishment parameters for each class come from the inventory management guide (reorder point, safety stock and EOQ). C items with steady usage are good candidates for kanban.
70/20/10 or 80/15/5 cut-offs
There is no mandatory cut-off. The map uses A up to 70%, B up to 90% and C up to 100%; many companies use 80/15/5. What matters is keeping the same rule over time and reclassifying at least once a year or whenever the mix changes. Cross the ABC with criticality too: a cheap C item can still stop the line.
Common mistakes
- Classifying without updating usage and cost data.
- Ranking by quantity instead of value.
- Not reviewing changes in the product mix.
- Treating every item the same way.
- Ignoring C items that are critical to production.
Benefits
- Prioritizes what drives inventory value.
- Improves accuracy and control.
- Guides purchasing, counting and negotiation.
- Cuts tied-up capital, waste and stockouts.
Frequently asked questions
What is ABC inventory analysis?
A classification of inventory items by annual value, separating the few items that hold most of the value (A) from the many low-value ones (C).
How do you do an ABC analysis?
Compute annual usage × unit cost for each item, sort from highest to lowest, calculate the cumulative percentage and classify using your chosen cut-offs.
What percentages are used in ABC classification?
There is no fixed rule; common cut-offs are 70/20/10 or 80/15/5 of cumulative value.
How often should the ABC classification be updated?
At least once a year and whenever the product mix or costs change significantly.
How does ABC analysis relate to Pareto?
ABC analysis applies the Pareto principle to inventory: a few items account for most of the value.
Sources
- CHOPRA, S.; MEINDL, P. Supply Chain Management: Strategy, Planning, and Operation. Hoboken: Pearson.
- SILVER, E. A.; PYKE, D. F.; THOMAS, D. J. Inventory and Production Management in Supply Chains. Boca Raton: CRC Press.
- SLACK, N.; BRANDON-JONES, A.; JOHNSTON, R. Operations Management. Harlow: Pearson.
Want inventory that turns without running out?
Download the free pull production e-book, with kanban, supermarkets and leveling.
Download the e-book
About the author
Lean Manufacturing & Behavioral Management Specialist
Over 20 years in the automotive and metalworking industries (GM and Dana), Lean Manufacturing practitioner since 2006. SENAI instructor and mentor in Brazil’s Brasil Mais Produtivo program, delivering consulting, training and audits for 50+ companies, combining quality, productivity and people development.